- Dynatrace Community
- Learn
- Troubleshooting
- RUM: What does a 'Max. user actions per minute exceeded' message mean?
- Subscribe to RSS Feed
- Mark as New
- Mark as Read
- Printer Friendly Page
- Mark as New
- Subscribe to RSS Feed
- Permalink
on 23 Jan 2024 04:10 PM
A 'Max. user actions per minute exceeded' event informs you that the number of user actions generated from Real User Monitoring (Web, Mobile, and OpenKit) has exceeded a limit that is specific to your environment. Once this limit is reached, Dynatrace automatically throttles the number of user sessions being captured until the number of user actions is below the limit again. The throttling is done on a user session basis in order to provide statistically correct values in Dynatrace. If the overall traffic volume drops, Dynatrace will automatically return to the capturing rate you've set for your environment.
Why does Dynatrace change the capture rate?
The maximum user action count per minute limit is specific to your environment and is there to prevent unexpected high consumption of your license volume by unexpected IT events like unannounced marketing campaigns, unplanned load tests, DDoS attacks, aggressive web scanners, or other.
What is the impact on the data visible in the Dynatrace UI?
During the event period, Dynatrace reduces the amount of captured user sessions on the cluster side. Some of the sessions aren't captured and therefore no further analysis is applied.
-
All count metrics are impacted (for example, user session count, user action count, and conversion count).
-
Rate metrics (for example, JavaScript error rate, conversion rate, crash rate, and bounce rate) aren't impacted, since sessions are either captured fully or not at all.
-
Capture of the user session on the cluster side has no impact on the injection of the RUM JavaScript.
Can my environment limit be changed?
Increasing the user action per minute limit leads to analysis of more user sessions and, therefore, also increases your DEM consumption.
Dynatrace SaaS
The maximum user action count per minute limit is specific to your environment. To configure this limit, go to Settings > Web and mobile monitoring > RUM overload prevention in the Dynatrace web UI.
Dynatrace Managed
The maximum user action count per minute limit is specific to your environment. You can configure this limit at Cluster Management Console > Environments in the Cluster overload prevention settings section.
How do I know if my RUM application has exceeded the limit?
Go to Session Segmentation and select Analysis over time on the findings panel. If your application has exceeded the limit, you should see the following message: An unexpected high traffic events occurred during the selected analysis timeframe.
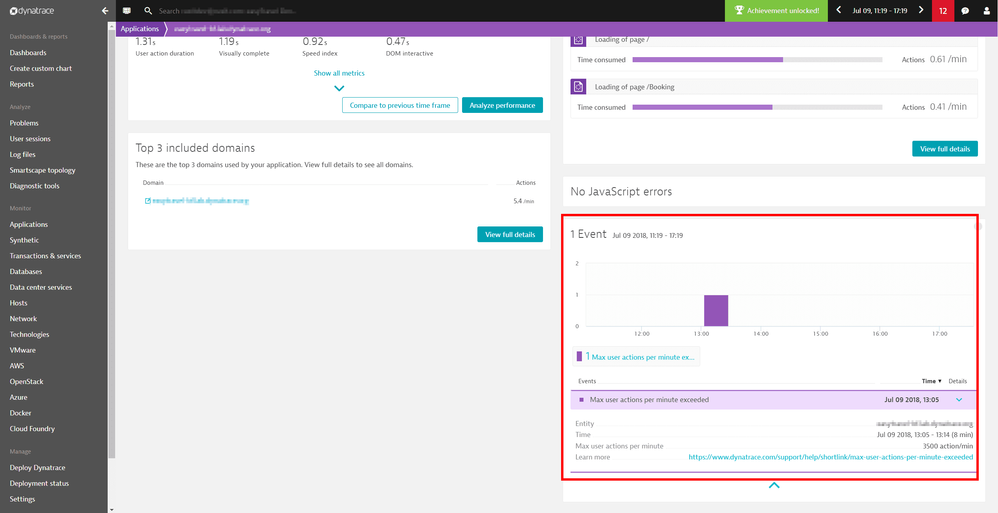
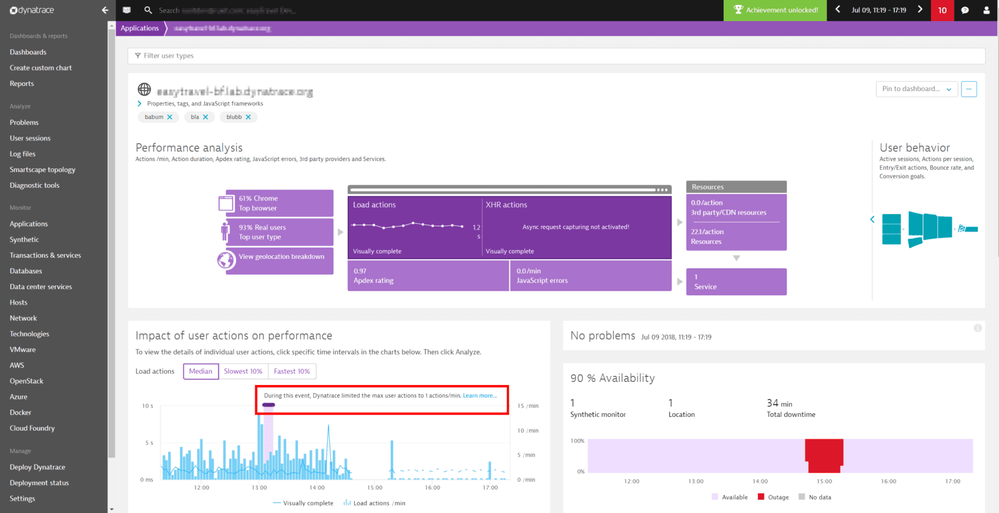
The Maximum user actions per minute limit events are listed under the Events and Impact of user actions on performance sections of the corresponding application overview page.

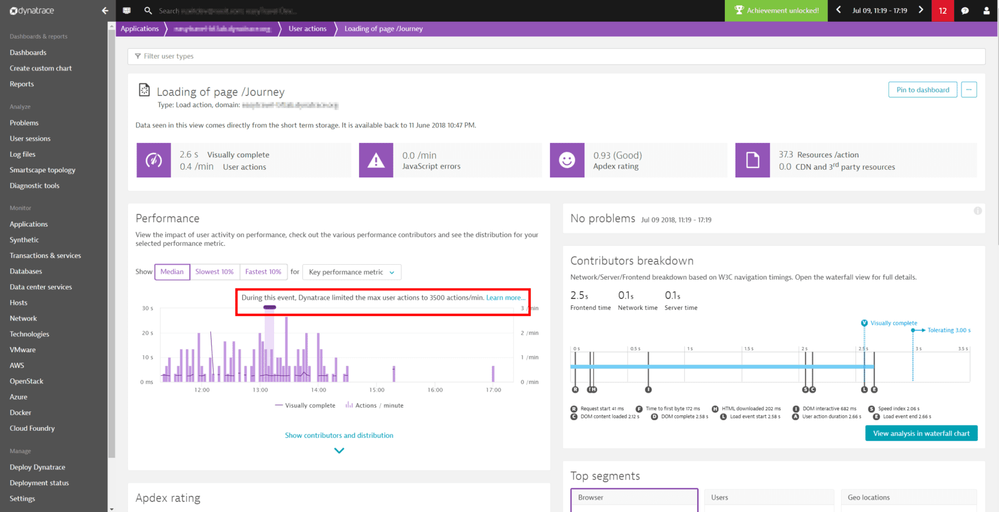
An alert is also displayed under the Performance section of User actions.

Is there a metric that shows the value of all user actions, so it can be used for calculating an accurate value for this setting?
Hello @maliborskaya
What other factors, aside from the maximum number of user actions permitted per minute, could influence the capture rate of user sessions?
Regards,
Babar Qayyum


