- Dynatrace Community
- Learn
- Troubleshooting
- SNMP-based Extensions Troubleshooting Guide
- Subscribe to RSS Feed
- Mark as New
- Mark as Read
- Printer Friendly Page
- Mark as New
- Subscribe to RSS Feed
- Permalink
on
22 Apr 2025
02:36 PM
- edited on
07 Aug 2025
10:14 AM
by
![]() jonghpark
jonghpark
- Summary
- Things to know
- Where to look for symptoms
- Problems
- SNMP always times out
- Custom interval logic
- SNMP DS restarted by ECC - CPU/ MEM exceeding
- Blocked fragmented IP/UDP packets in the network
- Fastcheck failed with an authentication error
- DEVICE_CONNECTION_ERROR
- Timeouts always - invalid privacy protocol
- Overflow of 32-bit counters
- Timeout on 32-bit or 64-bit specific counters
- What's next
Summary
This troubleshooting article will help resolve some common issues faced while installing and setting up SNMP-based extensions.
Things to know
Where to look for symptoms
Specific symptoms mentioned in this article can be seen in the Extensions app and file logs. Here is how you can find them.
SFM logs
SFM logs are available in the health tab on the Extension page in the Extensions app
- Log files can be found in paths:
- Linux: /var/lib/dynatrace/remotepluginmodule/log/extension/datasources/<directory_corresponding_to_the_used_extension>
- Windows: %PROGRAMDATA%/dynatrace/remotepluginmodule/log/extensions/datasources/<directory_corresponding_to_the_used_extension>
TCPdump
TCPdump collection steps
- Record communication from the ActiveGate, including traffic from the interface connected to the SNMP device, file format .cap
- Use the command below or https://www.wireshark.org/
Example:tcpdump -i \<interface\> -w \<output file\>tcpdump -i eth0 -w output.cap
Problems
SNMP always times out
Symptoms
- SNMP always times out on 1.3.6.1.2.1.1.5.0
- Changing timeout/ max retries/ max OIDs per query doesn't help
- SNMPwalk & SNMPget by Dynatrace don't work
- Querying by Third-party tools work
Troubleshooting
- Re-check passwords/ community string
- if they're copied, enter them manually (while copying, some white characters can be copied by mistake)
- if they have special characters (@ $ # % etc.) you might need to escape them with \ character, depending on your network device
- if these changes don't help to exclude problems with secrets, change the password to something simple like "12345678" and try once again
- Gather tcpdump ( tcpdump -w res.pcap) and look inside if there is visible request from AG to endpoint provided in config and if there is response:
- Yes
Look for the IP address, from which device is it responding, if it's different – SNMP data source won't recognize it. To confirm the issue, run SNMPwalk with below flag:
This command runs a performance health check, which runs a one-round query with all selected feature sets as separate queries. The result prints many useful pieces of information per single request. Such as response time, oids queried, oids returned and oids fetched../dynatracesourcesnmp --snmpwalk --ip $DEVICE_IP --oid $OID -v SNMPv2c -c $COMMUNITY_STRING -t 10 --unconnected-udp
This behavior can mean 2 things:- The device is configured to respond to a different interface; this should be reconfigured on the device itself
- There is some device in the middle between the ActiveGate and the device that changes the IP source for SNMP query responses
- No
Traffic is not reaching AG. This is most likely related to network problems.
- Yes
Custom interval logic
Symptoms
- Data gaps in intervals longer than the interval declared in the extension (for example, every 3 minutes instead of 1 minute)
- dsfm:extension.status not showing any error
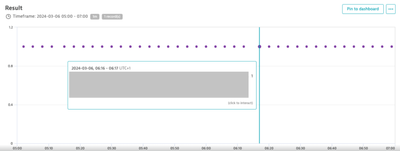
- dsfm:datasource.snmp.query.timemetric shows exceeded query time
- Datasource log: [ds:snmp] [info] [OK] TEST.COMPANY.COM SNMP query time exceeded: 1m41.212683135s, 2m9.964s, TEST.COMPANY.COM CpuTime: 925ms, MemRss: 561345
Solution
The defined interval needs to be changed. This can be done in 2 ways.
- Change the interval for specific extensions by modifying the extension.yaml. Check how to do it in the documentation: Extension YAML file — Dynatrace Docs
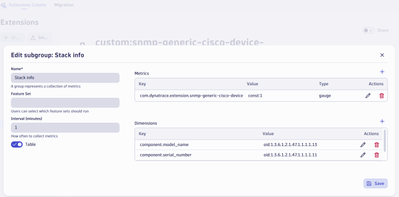
- Use the Custom Extensions Creator app to update this. The screenshot below shows where this field is available.
SNMP DS restarted by ECC - CPU/ MEM exceeding
Symptoms
- "HIGH_CPU" or "HIGH_MEMORY" logs status can be found in the snmp_statuses.log. DS hits the limits imposed by ECC
- dsfm:extension.engine.status with dt.extension.status dimension set to HIGH_CPU_RESTART (or HIGH_MEMORY_RESTART) is sent
Solution
- If you don't need to collect all metrics from the extension, turn off some feature sets in the activation monitoring configuration
- Set dedicated performance profile configuration (https://docs.dynatrace.com/docs/extend-dynatrace/extensions20/dedicated-performance-profile)
Blocked fragmented IP/UDP packets in the network
Symptoms
code 38 - DEVICE_CONNECTION_ERROR always with the same OID.
The error should be visible in SFM logs and file logs.
Solution
Decrease the advanced options parameter MaxRepetitions (size of response from f5), and if needed MaxOidsPerQuery (size of request)
Note:
- this solution may lead to higher CPU and memory usage.
- Low values of MaxRepetitions and MaxOidsPerQuery are not optimal, and cause that data source to need more time to request OIDs from the device
Fastcheck failed with an authentication error
Symptoms
AUTHENTICATION_ERROR with one of the messages: wrong digest for user, unsupported security level, unknown username
Troubleshooting
- wrong digest for user
- Double check the password is correct
- if copied, write them manually (while copying, some white characters can be copied by mistake)
- if the password has special characters (@ $ # % etc.), try removing them
- if these changes don't help to exclude problems with secrets, change the password to something simple like "12345678" and try once again
- Select correct authentication protocol (MD5, SHA, ...) in the Extension configuration
- Double check the password is correct
- unsupported security level
- Select the correct Security Level (authPriv, authNoPriv, noAuthNoPriv) in the Extension configuration
- unknown username
- Double check the user is correct in the Extension configuration
DEVICE_CONNECTION_ERROR
Symptom
Device logs are showing DEVICE_CONNECTION_ERROR, but the SNMP object of the call works
Solution
- With a tcpdump you'll have a complete overview of the traffic from the ActiveGate. Set it up based on the instructions above.
- Search the host in the file produced by the tcpdump collection. If the IP is different, it is because that it comes from a different interface device. Dynatrace data source does not support such a configuration.
- Since ActiveGate version 289+, we can check, with our binary, if a response is received, it confirms that the issue mentioned earlier is indeed the cause. In that case, the device should be reconfigured to ensure it responds on the same interface from which it receives requests. This is usually addressed by a network admin.
Timeouts always - invalid privacy protocol
Symptom
DEVICE_CONNECTION_ERROR - Timeout
Solution
Select the correct Privacy Protocol (AES, DES, ...) in the Extension configuration
Overflow of 32-bit counters
Symptom
Invalid values reported for Interface incoming traffic / Octets received / ifInOctets / 1.3.6.1.2.1.2.2.1.10 or Interface outgoing traffic / Octets transmitted / ifOutOctets / 1.3.6.1.2.1.2.2.1.16
Solution
Use high 64-bit capacity counters - enable Interfaces 64-bit feature set (disable Interfaces 32-bit)
Timeout on 32-bit or 64-bit specific counters
Standard 32-bit capacity traffic counters or high 64-bit capacity traffic counters are not supported in the device
Symptom
Timeout always seen on 1.3.6.1.2.1.2.2.1.10 or 1.3.6.1.2.1.2.2.1.16 or 1.3.6.1.2.1.31.1.1.1.6 or 1.3.6.1.2.1.31.1.1.1.10
Solution
Query the device using SNMPwalk for problematic OID to confirm that the OID is not available, then disable Interfaces 32-bit or Interfaces 64-bit accordingly, or reconfigure your device so OID is available
What's next
Please reach out to support if this article does not help. In the support ticket, please provide:
- Support Archive. How to collect a Support Archive
- Result of SNMPbulkwalk command for the OIDs not working
- tcpdump
- a link to this article and the outcome of the troubleshooting steps.
If this article has helped you and provided you with valuable insight, please give it a thumbs-up (kudos).
Hello, there,
I'm currently configuring network devices like F5, Fortigate, and Datapower to have visibility of them. I'd like to know if it's possible (and I recall seeing this somewhere) to see the network device through which the trace passed. For example, if it was an F5, it would appear in the trace as part of the communication. Is that possible?
regards.
Carlos Carrasco
If talking about trace/spans, than if those requests are intercepted by those devices, and they can insert HTTP headers, than it can happen. They would have to insert the trace-id headers and forward them to Dynatrace with OTEL. Have only seen one case (not out of the box) where this was done.
But you may also be talking about the proxy meta information available at the trace level. If the devices act like proxies, and forward the corresponding proxy headers, than that info will also be available.


