This website uses Cookies. Click Accept to agree to our website's cookie use as described in our Privacy Policy. Click Preferences to customize your cookie settings.
Troubleshooting
Articles about how to solve the most common problems
Turn on suggestions
Auto-suggest helps you quickly narrow down your search results by suggesting possible matches as you type.
- Dynatrace Community
- Learn
- Troubleshooting
- Web applications: Web request isn't linked to its user action
Options
- Subscribe to RSS Feed
- Mark as New
- Mark as Read
- Printer Friendly Page
Dynatrace Advisor
Options
- Mark as New
- Subscribe to RSS Feed
- Permalink
on 19 Mar 2024 07:30 PM
If there appears to be a missing link between a user action and its distributed trace, check the following for your web application.
- Verify that web requests are captured: Make sure that the server handling the web requests is instrumented with OneAgent and the web request is visible in Dynatrace. If some of the expected distributed traces are missing, check if OneAgent has adjusted the amount of data sent to the Dynatrace Server due to heavy load. See Adaptive traffic management for details.
- Verify that RUM is supported for the technology: In general, for distributed traces to be linked to their user actions, the technology on the first instrumented application tier must be one of the technologies listed in Technology support | Real User Monitoring | Web servers and applications or, for XHR calls, also in Deploy OneAgent as AWS Lambda extension.
- Verify that RUM is enabled on the process group: You must enable RUM on the process group that handles the request. If your application consists of multiple tiers, enable RUM at least on the first tier (the tier nearest to the browser). For details, see Real User Monitoring for process groups.
- Check if the web request is a cross-origin request. If it is, follow the instructions in Link cross-origin XHR user actions and their distributed traces.
- Check if there is a cookie domain issue: Host name determination issues might impair the automatic determination of the cookie domain, or the cookie domain might have been misconfigured manually. See Configure the RUM cookie domain for web applications for details.
- Make sure that your firewalls and proxies let RUM cookies and headers pass through. See Firewall constraints for RUM for details.
- If you configured your infrastructure to add the
HttpOnlyattribute todtCookie, remove this attribute; it is not supported for RUM cookies. See Cookies for details.
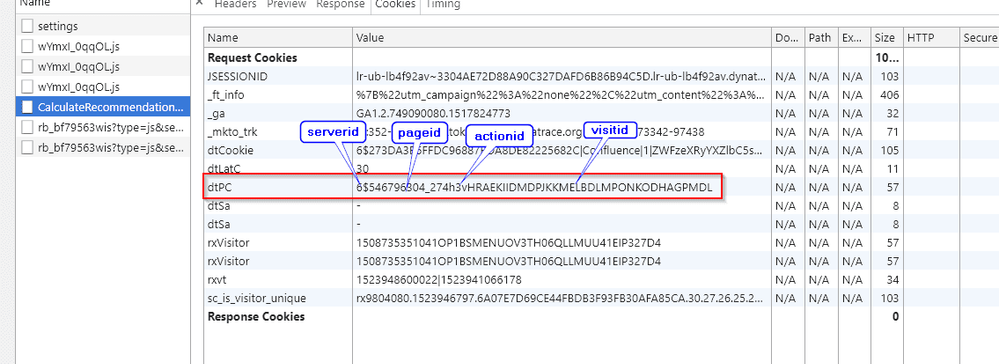
Sometimes, it's also beneficial to know which user action a given web request should be linked to.
- When an action is active with a user input and XHR, the RUM JavaScript sets the
dtPCrequest cookie value. This value containspageIdandactionIdand might also containserveridandvisitidvalues in the value string. - To see the values, use Chrome DevTools.
- To see the
dtPCrequest cookie value, perform the desired action in your application, go to the Network tab, and find the request name in the Name column. Select the request name, go to the Cookies tab, and check the value for thedtPCrequest cookie, as shown in the following image. The format for the DynatracedtPCrequest cookie values is<serverId>$<pageId>h<actionId>v<visitId>.

