- Dynatrace Community
- Community
- Community challenges
- Re: Take the "Alert of the day" challenge!
- Subscribe to RSS Feed
- Mark Topic as New
- Mark Topic as Read
- Pin this Topic for Current User
- Bookmark
- Follow
- Mute
- Printer Friendly Page
Take the "Alert of the day" challenge!
- Mark as New
- Bookmark
- Follow
- Mute
- Subscribe to RSS Feed
- Permalink
20 Apr 2021
12:15 PM
- last edited on
27 Apr 2021
09:14 AM
by
![]() Karolina_Linda
Karolina_Linda
Hello Community!
We're pleased to share a second challenge where you can also win a new and unique badge!
At Dynatrace, we continuously develop a product that can save your time and let your teams focus on innovation. We believe that Dynatrace alerting capabilities provide a lot of options to avoid any delays in your customer digital journey, but we're curious to hear your personal experience.
Tell us about the alerts that give you the most precise solutions and improve your work. Maybe you have an “Alert saved the day” story? Or just your favorite, most time-saving alert configuration?
Share your expertise with your fellow Community members and let's learn from each other.
Everyone who shares their alert story or screenshot will get a new limited-edition badge and +100 bonus points which can help you get a higher rank in the Dynatrace Community.
Entries close on May 11th and on that day we will reward all participants with the new badge.
Can’t wait to see your favorite alerts!
- Labels:
-
community challenge
- Mark as New
- Bookmark
- Follow
- Mute
- Subscribe to RSS Feed
- Permalink
20 Apr 2021 10:41 PM
There are alerts and alerts... Most of the alerts that occur in Dynatrace happen when there is a problem. And that's not normally good news. What's better though is that Dynatrace alerts normally give us excellent MTTI (Mean Time To Identify), which also normally gives us even better MTTRs (Mean Time To Repair) given the mostly available root cause detection.
Given this, one of the types of alerts that I most like are those ones that tell me that bad things might be happening, but have not happened yet. Like the disk is getting almost full. It has probably saved the day, because simply the problem didn't happen! It's also on the top of my wish list for Dynatrace: giving me an indication of what might be happening in the future!
- Mark as New
- Bookmark
- Follow
- Mute
- Subscribe to RSS Feed
- Permalink
21 Apr 2021 12:17 PM
In case of monitoring our legacy community platform, we found the alerts on the user action duration degradation and the JavaScript error rate increase extremely helpful. That way, we immediately knew that, for example, our workarounds for particular forum issues weren't following the best development practices 😉 The same applied to too large banners, images, etc. The things that work for us don't necessarily need to work for others, so Dynatrace alerts were making us aware of the issues that we were not seeing at the first glance.
- Mark as New
- Bookmark
- Follow
- Mute
- Subscribe to RSS Feed
- Permalink
21 Apr 2021 01:22 PM
Over the years I have shared multiple use cases and methods with Dynatrace. One that we didn't share centered on 3rd party requests and a rogue firewall change.
Early on with our Dynatrace Journey we were alerted to an increase of failures to our 3rd party vendor. Dynatrace alerted us of this issue as it deviated from our baseline. But keep in mind we were also very new to Dynatrace. Immediately we started to look into the failure rate increase alert and found that at 8am failures went from 0% to 100%. Dynatrace provided us the URL and the port number that this request was coming from and its 3rd Party destination.
Immediately we raised this issue to senior staff who called out to Ecommerce to confirm/deny our findings. Senior staff asked Ecommerce to initiate a "Synthetic" sale. Shortly there after Ecommerce stated that their Synthetic sale completed without issue.
At this point we were all thinking that Dynatrace might have given us a false positive. It wasn't until AppDev came running stating that they were also seeing failures.... 30 mins after Dynatrace detected the first failure. We worked together along with the Network Team to discover that another employee had a made a rogue firewall change. Immediately corrective action was taken, and at 9am we saw failures drop to 0%.
There was still a question though - "Why did the Ecommerce pass without issue?" As it turned out the system was designed to never provide users any errors, rather give them a "simulated response". This event sparked discussions and corrective action to ensure similar future scenarios would provide true test data.
Ultimately, Dynatrace did its job. We had a major issue that lasted 1 hour, but if we had trusted Dynatrace more and tests came back with true results, then we could have reduced this downtime by half! Because of this issue not only was corrective action taken in the Ecommerce Synthetics, but also showed staff that they can trust Dynatrace and helped foster a growing relationship with App Dev and the Dynatrace Team.
- Mark as New
- Bookmark
- Follow
- Mute
- Subscribe to RSS Feed
- Permalink
23 Apr 2021 10:52 AM
There where a few great alerts, but as a partner they are always harder to share if it's not "your" environment.
Some of my favorite alerts where during PoCs though where the customer already had a vague idea what was causing problems but wasn't able to verify/prove it e.g. to a third party vendor.
Dynatrace picks up the problem, identifies the root cause automatically --> great use case for the presentation.
- Mark as New
- Bookmark
- Follow
- Mute
- Subscribe to RSS Feed
- Permalink
23 Apr 2021 11:29 AM
that's indeed a nice scenario 🙂
- Mark as New
- Bookmark
- Follow
- Mute
- Subscribe to RSS Feed
- Permalink
26 Apr 2021 01:20 PM
Of course I can't imagine to work without Dynatrace! One of the most powerful and most common issue we were hit in one of our internal services is a common "N+1 JPA" issue. This is related to retrieving data from a database. The problems occurs when a SQL query is executed to fetch N records and each of N records need additional query to fetch some relational records... and so on. As a result one operation results in hundreds or thousands of SQL queries ... which of course is slow and impacts end-user. Dynatrace alerts on "Response time degradation" quickly and shows this at hand - it reduces MTTR (as @AntonioSousa mentions) to the max!
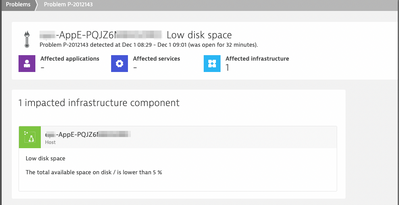
The other - small, quick but yet powerful -> Who remembers or cares every day if the disk space on one of dozens or hundreds of hosts is sufficient? Dynatrace! A quick alert reminder and problem solved:
Dynatrace Managed expert
- Mark as New
- Bookmark
- Follow
- Mute
- Subscribe to RSS Feed
- Permalink
31 Mar 2022 02:26 PM
The good ole N+1 issue.
- Mark as New
- Bookmark
- Follow
- Mute
- Subscribe to RSS Feed
- Permalink
26 Apr 2021 04:50 PM
Hello team.
The alert we use the most is custom alerts. These help us to identify with greater sensitivity possible failures in the applications or services that we are monitoring. We like to know much earlier for certain applications that an error that is just beginning is showing. In this way, the response time is much longer and the impact on the end customers is less. (For 100% critical applications.)
Additionally, our team works with IIS, which is very important in the face of an APPpool crash that is quickly identified.
>The Process group availability monitoring alert
>>if any process becomes unavailable
This alert is very useful.
Best Regards
- Mark as New
- Bookmark
- Follow
- Mute
- Subscribe to RSS Feed
- Permalink
04 May 2021 01:12 PM
I truly enjoy the variety of use cases shared in this challenge 🙂 It's interesting to see how we utilize the same functionality depending on our needs, teams we work in, business goals, etc.
Thanks for sharing!
- Mark as New
- Bookmark
- Follow
- Mute
- Subscribe to RSS Feed
- Permalink
03 May 2021 06:42 PM
A really useful one is the ones we receive from our HTTP monitors.
We have a situation where the application heavily relies on the information from 3rd party integrations to work. By creating some multi request HTTP Monitors, we are simulating those integrations and notifying the team ahead of time about the issue.
These alerts have changed the way that the operations team works and reduced the MTTD and MTTR.
- Mark as New
- Bookmark
- Follow
- Mute
- Subscribe to RSS Feed
- Permalink
04 May 2021 10:01 AM
One of my favourite alerts recently was a case of calls to an external service, where the customer got charged by volume of successful requests. Dynatrace alerted on the calling service because in 60% of the cases it returned an HTTP 400 to the client due to wrong payload.
However the call to the external service was still being made (and "successful) and therefore charged. By fixing the wrong payload handling and immediately returning instead of performing the 3rd party service call the cost was reduced significantly.
Without the service dependency and traces this would have gone unnoticed or the cost impact would not have been discovered.
- Mark as New
- Bookmark
- Follow
- Mute
- Subscribe to RSS Feed
- Permalink
07 May 2021 05:43 AM
My favorite alerts are those when in a PoC a client discovers a problem that he does not know he has and he gets an alert. Lots on the list, I/O, Garbage Collector, Memory Saturation Of course I always have a little help from DAVIES 😜 I love seeing the expressions on their faces and finally they said, DAVIES is not just a pretty face.
- Mark as New
- Bookmark
- Follow
- Mute
- Subscribe to RSS Feed
- Permalink
07 May 2021 12:00 PM
now I would love to see their faces, too! 😄
- Mark as New
- Bookmark
- Follow
- Mute
- Subscribe to RSS Feed
- Permalink
07 May 2021 12:18 PM
- Mark as New
- Bookmark
- Follow
- Mute
- Subscribe to RSS Feed
- Permalink
10 May 2021 12:41 AM
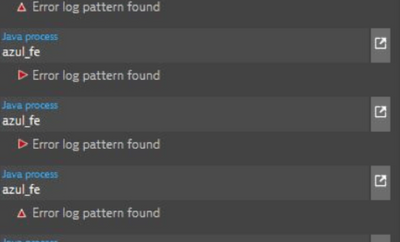
My "Alert saved the day” story would be when Dynatrace alerted us regarding a third party service outage responsible for processing customers' applications. Capturing specific log messages was the only indication that the third party vendor was having issues.
"There were no other indications that this third-party service was having a problem apart from the errors in the log files. That is what made the log analysis valuable in this case. We configured a custom log event to look for the known error that can occur when the third-party service is not functioning properly.
Dynatrace alerted us to the problem when the error messages started appearing in the logs. We know that when this specific error appears, we need to contact the third party to investigate.
Without Dynatrace Log Analytics catching these errors, the problem would have continued until our back-office teams noticed, which could have taken days or weeks. We contacted the third party, and they confirmed an issue on their side, which was quickly resolved, saving us time and money.”
- Mark as New
- Bookmark
- Follow
- Mute
- Subscribe to RSS Feed
- Permalink
12 May 2021 02:09 PM
Many thanks to you all for the wonderful alerting stories. It was a real pleasure to read about so many different experiences. By the end of the week, each of you will receive a new, special badge on your profile. Looking forward to your participation in our next challenge 🙂
- Mark as New
- Bookmark
- Follow
- Mute
- Subscribe to RSS Feed
- Permalink
08 Mar 2022 05:56 AM
One of the beautiful things in the Dynatrace is OOB alerting on applications, infrastructures, and services based on the baseline and static thresholds.
Working with the complex environment, I have created custom alerts based on certain exception messages e.g. request timeout, read timeout, etc to inform us immediately before customers start complaining about our services.
Also, the second most important alert for us is to make sure that WebContainer threads, JVM threads, and JDBC pool size are not misbehaving to bring it down the whole application.
I can go on and on but I think for the time being above one are sufficient 😀
- Mark as New
- Bookmark
- Follow
- Mute
- Subscribe to RSS Feed
- Permalink
08 Mar 2022 01:58 PM
Thanks for sharing, Babar! Alerts/mistakes that we can see are a crucial part of improvement and better efficiency! 📈
- Mark as New
- Bookmark
- Follow
- Mute
- Subscribe to RSS Feed
- Permalink
08 Mar 2022 04:23 PM - edited 08 Mar 2022 04:24 PM
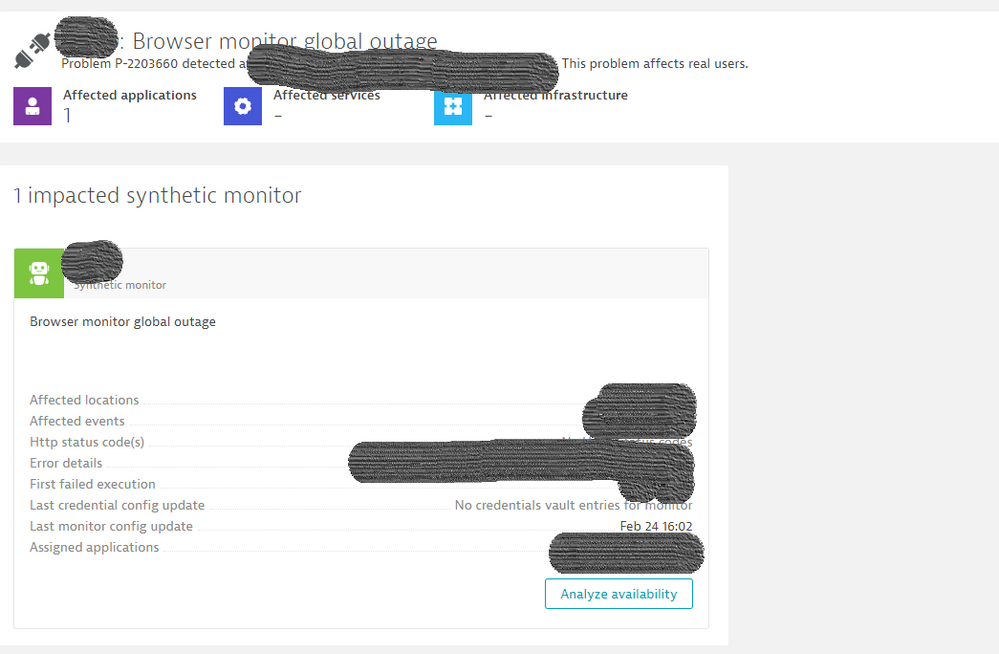
Our "alert of the day" was synthetic monitor alert
We were able to fix the issue before business hours and therefore avoid impact on real users
- Mark as New
- Bookmark
- Follow
- Mute
- Subscribe to RSS Feed
- Permalink
08 Mar 2022 06:02 PM
Thanks for sharing! ![]()
Great to see that Dynatrace helped you avoid the real issues.
- Mark as New
- Bookmark
- Follow
- Mute
- Subscribe to RSS Feed
- Permalink
31 Mar 2022 01:42 AM
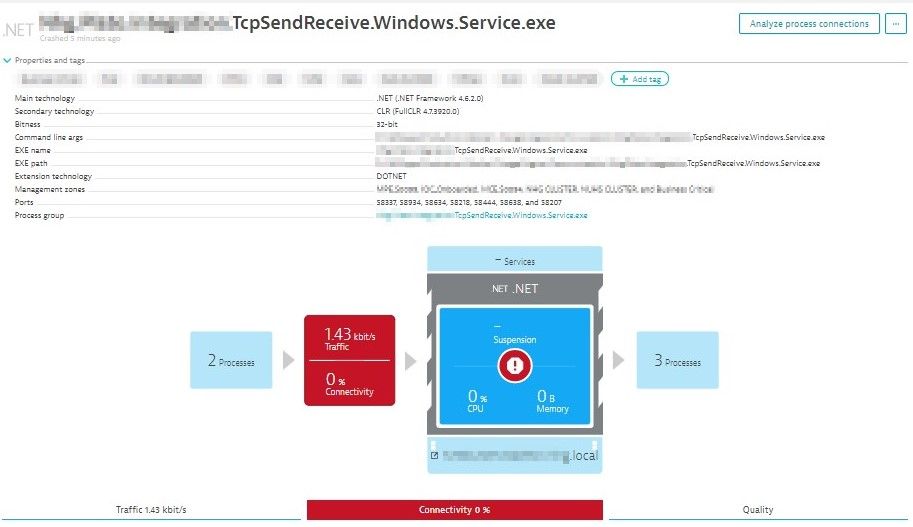
This connectivity issue is our alert of the day, the process is running but in a hang state. It did not trigger a process unavailable alert but a connectivity alert instead.
We quickly restarted it and prevented an incident before users are affected.
- Mark as New
- Bookmark
- Follow
- Mute
- Subscribe to RSS Feed
- Permalink
31 Mar 2022 02:30 PM
Where do I start?
1.) Alerts if Worker Processes go under a threshold
2.) Alert if VCT goes above a threshold like 2.5 sec
3.) We have a SQL plugin that we use to check blocking on a SQL server. We setup alert to know if the plugin is NOT working. Very important for everyone to have this in your environment
Many more but those are the top ones.
- Mark as New
- Bookmark
- Follow
- Mute
- Subscribe to RSS Feed
- Permalink
02 Apr 2022 11:40 AM - edited 02 Apr 2022 11:44 AM
Here are 3 alerts added to dynatrace after customers request for alerts that were missing OOTB ![]() and now they are on 🤗
and now they are on 🤗
1. Check if number of process restarts per node is not reaching a limit - for that we need to create AG extension that pulls the restart events from dynatrace with Rest API and push it back with Metric Rest API to dynatrace, from here the way to set the alert was short ![]()
2. Check if batch POD is running each day between 7:00 and 7:10 - once again we need create AG extension that pulls that data from dynatrace and push it back as a metric.
3. SMS messages to customers were stuck for more than a week (!!!), can we monitor this? - that was easy one, after we found out that the SMS queue is managed by MSMQ, we added MSMQ OA extension to the environment and set it on the host, and also this alert is covered by dynatrace ![]()
We like those ones because it so easy to implement them !!!
All the best and stay safe
Yos
- Mark as New
- Bookmark
- Follow
- Mute
- Subscribe to RSS Feed
- Permalink
02 Apr 2022 07:17 PM
Alerts..I am sure this very interesting topic..I would like to share one alert setup which resolve very potential and long running issue.
Memory utilisation was very high whenever calls goes to "unmonitored host". As unmonitored host is used to have multiple IPs which was bit tricky to track which host/IP is the culprit. However, thanks for Custom Device component, by setup custom device I was able to break unmonitored host to individual host/ip and then configured alert setup. So now with the help of alert setup app team take very short time to fix whereas initially it was painful process.
Thanks,
Sujit
- Mark as New
- Bookmark
- Follow
- Mute
- Subscribe to RSS Feed
- Permalink
04 Apr 2022 02:38 PM
I like Synthetic alerts histories... they always tells us that if something not expected are happening is because someone else has messed up with something.
One of my clients did contacted me back asking help to validade why they were receiving alerts for one of their synthetic monitoring on the weekend.
I pointed out to them the exactly failing step, using the Dynatrace history execution, and when the issue started... This person who contacted me were not aligned with the dev team, who changed the front end application to use a different log in screen, and since then, the css selector which should be present on the page were not being found, and causing the alert.
The application was up and fine, but the changes done on the code were not updated on the Dynatrace monitor properly.
Things like this show us the needs for DevOps, or even NoOps, when you automate your deployments with your lovely monitoring tool, using APIs to update the synthetic monitor steps and send Events telling everyone who checks the monitoring that a deployment was done.
Davis is smart, but it can do a better job when we help her, telling what is happening under the table.
Alerts are not there only to wake us up and fix the issues, it also tells us that something can be enhanced, automated.
No one should like alerts, they should be there only to make us angry and make them gone away forever, right on the root cause.
- Mark as New
- Bookmark
- Follow
- Mute
- Subscribe to RSS Feed
- Permalink
12 Apr 2022 09:27 AM
Helllooo,
Alerting is one the most important option in the Dynatrace configurations.
For each application in our platform, we have 3 kind of alerts (per severity): Warning if the problem still open for 15mn, Major for 20mn and Critical for 25mn.
Each severity has his list of recipients to be pertinent.
We are now working to Add SMS Alert if the severity Critical is reached (but Im facing a small challenge, the Password is not a clear string, but a call to an encrypted function...).
Not talking about a specific custom alerts (max pool number reached....).
To be honest, alerting is a big area and hope we can explore the largest types.
Have fun, and have a good day.
- Mark as New
- Bookmark
- Follow
- Mute
- Subscribe to RSS Feed
- Permalink
13 Apr 2022 07:23 AM
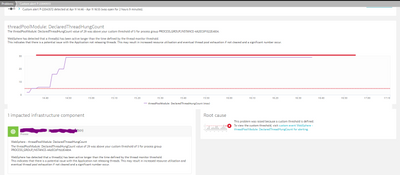
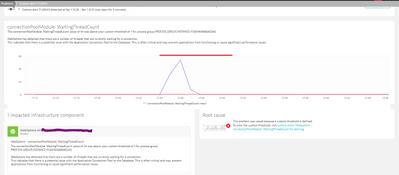
One of our most useful alert combos are custom ones we set up to detect hung threads & waiting thread counts in WebSphere.
Hung threads are a lead indicator to the JVM's going into a hung state which can have flow on effects (it is breaking).
Waiting Thread count is a lead indicator to say that the JVM is not processing.
It also is generally related to non thread safe code or configuration where a thread leak is occurring.
so it is extremely helpful in identifying issues early.
We can catch the impacted JVM early before it contaminates the rest of JVM's and allows for targeted JVM recycle.
- Mark as New
- Bookmark
- Follow
- Mute
- Subscribe to RSS Feed
- Permalink
09 May 2022 05:29 AM
Alerts are very useful for business controlling the business impact due to and unwanted anomaly or issues with the application host or services. With one of our client the business had a requirement for premium customer with rich devices (iOS devices), the alerts for business use case were defined on the basis of static threshold for few of the key service calls like app launch, login and other non financial transaction. Dynatrace helped us to identify the service calls and set static thresholds as per Business needs for those service which help us to understand the user impact due to slowness in app performance resulting when the threshold level was breached by the services.
Whenever a customer use to take longer time for login into the app custom alerts were trigger to respective user group and which later use to debug the root cause for response slowness and help to get the issue resolved accordingly. This brought value to increase application performance and enhance user experience for rich devices.
Featured Posts

