- Dynatrace Community
- Ask
- Container platforms
- ActiveGate not working on AKS cluster
- Subscribe to RSS Feed
- Mark Topic as New
- Mark Topic as Read
- Pin this Topic for Current User
- Printer Friendly Page
ActiveGate not working on AKS cluster
- Mark as New
- Subscribe to RSS Feed
- Permalink
28 Aug 2023
09:54 PM
- last edited on
29 Aug 2023
08:18 AM
by
![]() MaciejNeumann
MaciejNeumann
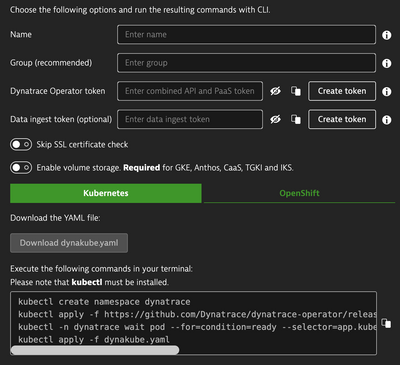
When i deploy the dynatrace operator on my aks cluster following the instructions given to me here:
the deployment its succesfull
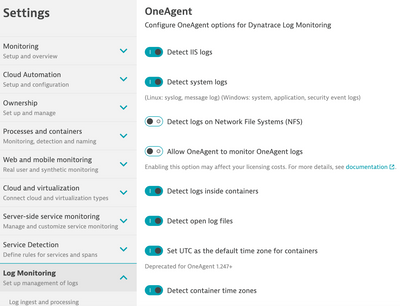
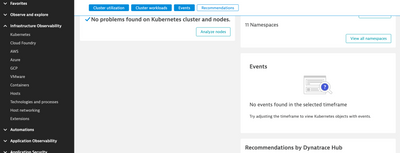
but when i go to my infraestructure obsevability tab on dynatrace to watch logs of my applications there is none, i have configured my logs monitoring like so:
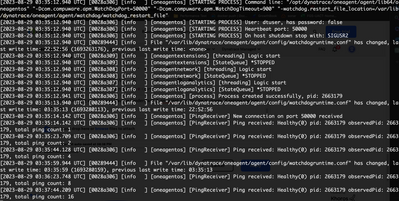
the logs of the activegate agent on my aks cluster are the following:
would love any help.
- Labels:
-
application monitoring
-
azure
-
logs
- Mark as New
- Subscribe to RSS Feed
- Permalink
28 Aug 2023 10:43 PM
Hi @aureliano_buend,
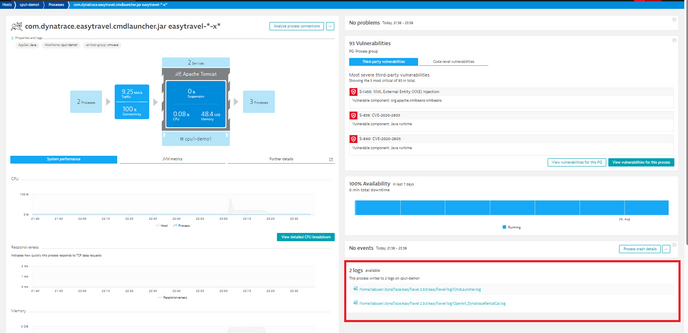
Do you see the dicovered log files at your processes from AKS?
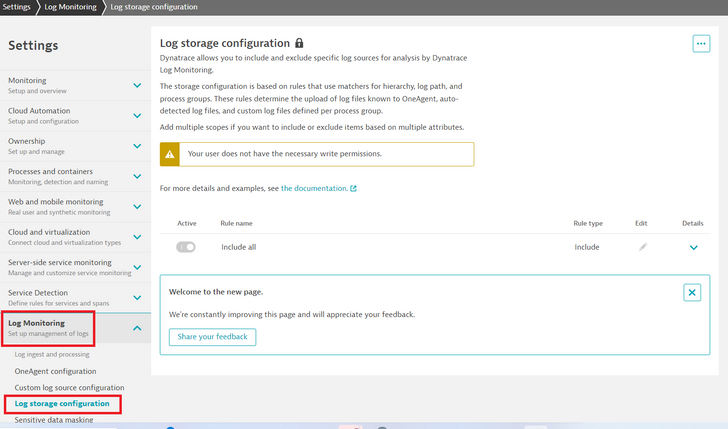
If yes you should use this to define by rules which logs would you like to analyse in the LOG viewer:
I hope it helps.
Best regards,
Mizső
- Mark as New
- Subscribe to RSS Feed
- Permalink
29 Aug 2023 04:50 AM - edited 29 Aug 2023 04:53 AM
Hey, thank you for your reply
i don't see any discovery logs from my kubernetes, but maybe i'm looking at the wrong place
also after a few tries of removing and redeploying the agent i notice that dynatrace its able to get logs for a few minutes and then crashes, after searching in the logs of the pod of activegate i found the following message, i don't know if has something to do with the problem:
[DalWatchClientAdapter] Watching for changes (/api/v1/events) timed out. Will reconnect with resourceVersion='203570': java.net.SocketTimeoutException: Read timed out [Suppressing further messages for 30 minutes


Stream closed EOF for dynatrace/activegate-0 (certificate-loader)
still i think i'm looking at the wrong place as i understand it, oneagent was the one in charge of getting the logs.
Looking at the logs in the oneagent pod everything seems normal to me.
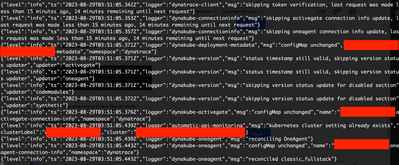
logs of the operator:
everything in the webhook pod seems ok also.
I think i'm even more lost now than at the start, was thinking of using maybe an otel operator or fluentd to get the logs of the pods and sending them to dynatrace, is this supported?
- Mark as New
- Subscribe to RSS Feed
- Permalink
05 Jun 2025 02:29 PM
Hey @aureliano_buend , did you manage to find the solution to your problem? If so, it would be amazing if you've shared it with the rest of the Community! If not, let me know, and I'll look for some further assistance 😊
