- Subscribe to RSS Feed
- Mark Topic as New
- Mark Topic as Read
- Pin this Topic for Current User
- Printer Friendly Page
- Mark as New
- Subscribe to RSS Feed
- Permalink
23 Jan 2024 02:05 PM
Good morning.
I am creating a dashboard for Openshift queue information.
The client requests to have a graph showing the messages queued for each queue.
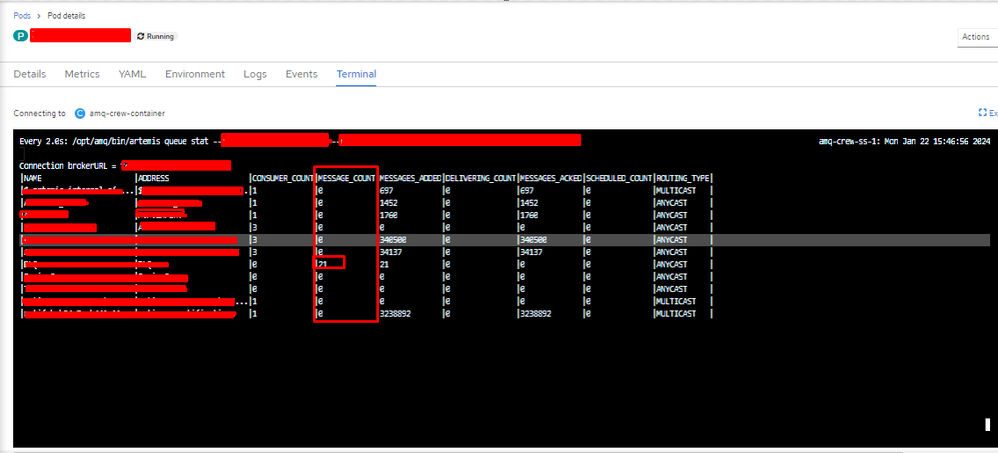
From the openshift console the queued messages are observed in the MESSAGE_COUNT option is the field that shows the queued messages.
Can someone please help me by telling me how I can get this information from dynatrace?
I have used the metrics of:
builtin:queue.incoming_requests:splitBy("dt.entity.queue"):sum
builtin:queue.outgoing_requests:splitBy("dt.entity.queue"):sum
But these metrics do not show what the client needs to see which is the messages queued by each queue.
Greetings,
Solved! Go to Solution.
- Labels:
-
kubernetes
-
openshift
- Mark as New
- Subscribe to RSS Feed
- Permalink
23 Jan 2024 03:18 PM
@Mizső, Do you know anything about this? Can you help me please. ?
- Mark as New
- Subscribe to RSS Feed
- Permalink
23 Jan 2024 03:38 PM
Hi @Ccastrillon
Is it possible to share a screen shot about the Openshift Console?
Best regards,
Mizső
- Mark as New
- Subscribe to RSS Feed
- Permalink
23 Jan 2024 04:18 PM - edited 23 Jan 2024 04:20 PM

- Mark as New
- Subscribe to RSS Feed
- Permalink
24 Jan 2024 07:31 AM
Maybe using your own JMX extension can help.
https://docs.dynatrace.com/docs/shortlink/jmx-extensions#create-a-jmx-extension
Looks like artemis is able to produce this info
https://activemq.apache.org/components/artemis/documentation/latest/management.html#message-counters
Featured Posts
