This website uses Cookies. Click Accept to agree to our website's cookie use as described in our Privacy Policy. Click Preferences to customize your cookie settings.
DQL
Questions about Dynatrace Query Language
Turn on suggestions
Auto-suggest helps you quickly narrow down your search results by suggesting possible matches as you type.
- Community Home
- Platform
- DQL
- Re: Create a 'timeseries-chart' of totals
Options
- Subscribe to RSS Feed
- Mark Topic as New
- Mark Topic as Read
- Pin this Topic for Current User
- Printer Friendly Page
Options
- Mark as New
- Subscribe to RSS Feed
- Permalink
12 May 2025
08:03 AM
- last edited on
12 May 2025
08:32 AM
by
![]() MaciejNeumann
MaciejNeumann
Hi All,
I'd like to create a 'timeseries-chart' of totals, for example total number of cars per type, per month. Using 'interval=30d' gives me a 'sliding window' of totals per 30 days, not per month and not starting the first of every month. I want to get an overview of totals for Januari, Februari, Match etc.
Does anyone know how to do this?
Regrads, Chiel
Solved! Go to Solution.
4 REPLIES 4
Options
- Mark as New
- Subscribe to RSS Feed
- Permalink
12 May 2025 10:41 PM
This is possible, but requires some steps. Suppose your starting point is timeseries data with interval=24h. In this case, you would use three additional steps:
- Transform your timeseries data to generate a separate record for each day. You can start with this DQL snippet and adapt to your needs.
- Use the getMonth function to extract the month of the year into a new field.
- Use the summarize command to generate totals by month and use this data as the basis for your visualization.
Options
- Mark as New
- Subscribe to RSS Feed
- Permalink
13 May 2025 07:38 AM
Hi Marco,
Thanks for your reply.
As you describe it, it worked, but how do you visualize this?
....
| fieldsAdd month = getMonth(timestamp)
| summarize countDistinct(serverName), by:{month,currentOSVersion}
| month | currentOSVersion | countDistinct(serverName) |
| 4 | Microsoft Windows Server 2016 Stand | 141 |
| 4 | Microsoft Windows Server 2019 Standard | 163 |
| 5 | Microsoft Windows Server 2019 Standard | 139 |
| 5 | Microsoft Windows Server 2019 Stand | 164 |
| 5 | Microsoft Windows Server 2022 Standard | 211 |
Because there is no 'real' timestamp anymore in the output, it is not possible to make a bar chart or something like that. The maketimeseries command would be the most obvious for my initial question, but then you cannot make totals per month.
Options
- Mark as New
- Subscribe to RSS Feed
- Permalink
13 May 2025 09:52 PM
getMonth() gives you only month number, which will not be nicely cartable on x-axis where we want to see actual time.
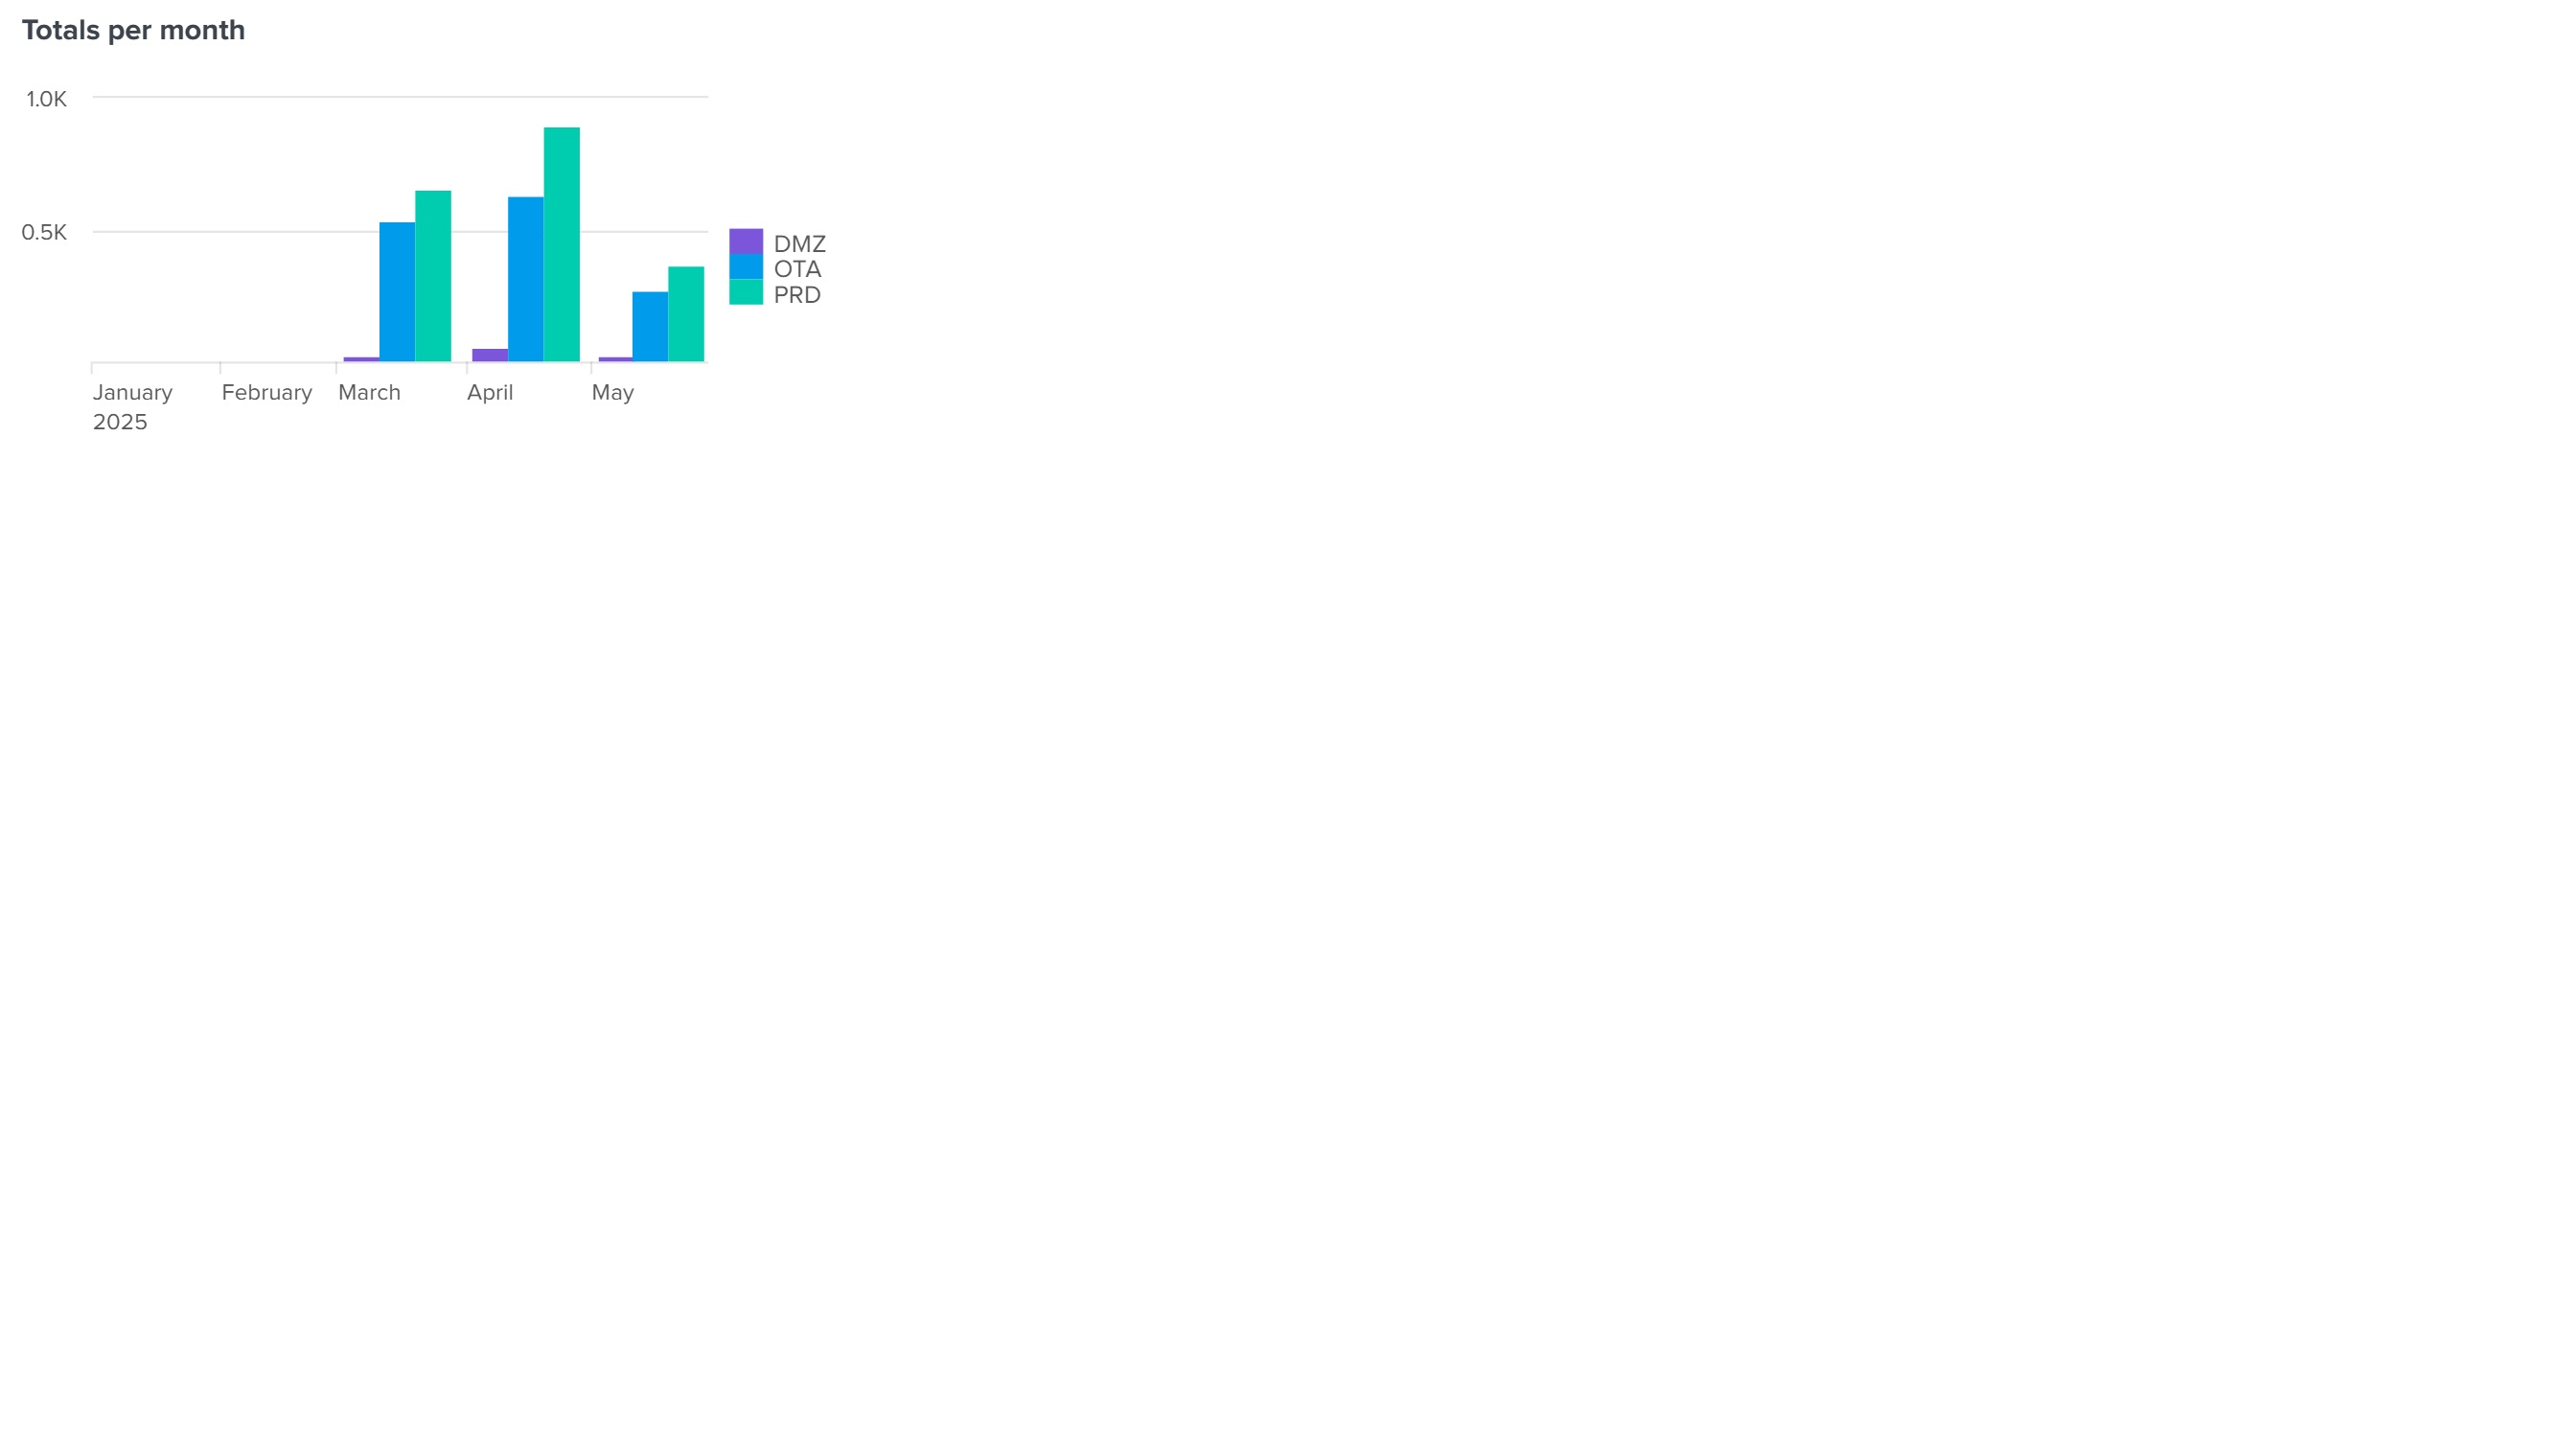
let's start with simpler example where the source is not a metric, but event/logs/etc. If we introduce grouping by timeframes defined as full months using @ time alignment operator then bars will reflect full months:
fetch bizevents
| summarize count(), by: { event.provider, timeframe = timeframe(from: timestamp@M, to:timestamp@M+1M) }

When the source is a metric, steps described by @marco_irmer are correct, but I would use technique I described above.
timeseries { req=sum(dt.service.request.count), timestamp=start() } , by:{http.response.status_code}
| fieldsAdd d=record(timestamp=timestamp[], req=req[])
| expand d
| summarize req=sum(d[req]), by: { http.response.status_code=toString(http.response.status_code),
  timeframe = timeframe(from: d[timestamp]@M, to:d[timestamp]@M+1M) }

additionally by using start() function in timeseries, we immediately have timestamp of datapoint
Reply
Options
- Mark as New
- Subscribe to RSS Feed
- Permalink
14 May 2025 08:20 AM
This is what I was looking for. Thanks a lot!
Featured Posts
