- Dynatrace Community
- Dynatrace
- Ask
- Dashboarding
- Re: Apply filtering to Dashboards by computational consumption
- Subscribe to RSS Feed
- Mark Topic as New
- Mark Topic as Read
- Pin this Topic for Current User
- Printer Friendly Page
Apply filtering to dashboards by computational consumption
- Mark as New
- Subscribe to RSS Feed
- Permalink
21 Jul 2021
06:41 PM
- last edited on
31 May 2023
02:30 PM
by
![]() Michal_Gebacki
Michal_Gebacki
Hi!
A need arose where I couldn't find a filter option for displaying in a dashboard (Dynatrace Managed).
It is necessary to display the hostname of the hosts that had cpu/memory consumption above 80% in the selected timeframe. It would be necessary to perform a kind of "query" based on usage and this was not found in the tool, we know that the dashboards list from the highest consumption to the lowest or the opposite, but we want a view that "discards" hosts that consume below 80% in dashboard display.
In request attributes it is also not possible because this demand is not a service layer.
- Mark as New
- Subscribe to RSS Feed
- Permalink
21 Jul 2021 07:45 PM
Hello,
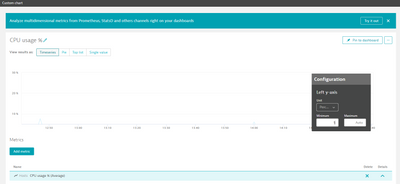
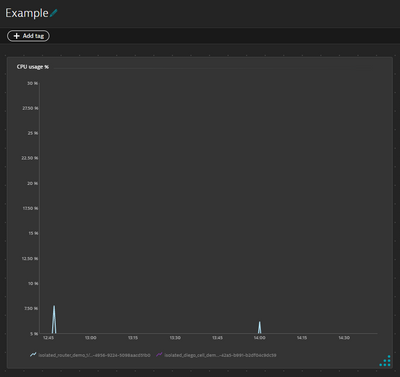
The only option I can think of is to use a chart filter to set a minimum threshold for the Y axis. This will allow you to pin a chart to a dashboard that only shows the hosts that go above that particular value - as seen in the screenshots below.
However, there is not a way to show this data in a different chart type (such as Top List only showing >80%), and if you drill into the chart, the table of data will still include all entities regardless of if they are within the chart thresholds or not.
Dynatrace Certified Professional
- Mark as New
- Subscribe to RSS Feed
- Permalink
22 Jul 2021 01:26 PM
Hi @ryan_ott !
Thanks for the feedback, unfortunately the customer's need is a list containing only the cut edge hosts.
Again thanks for your feedback!


