- Dynatrace Community
- Dynatrace
- Ask
- Dashboarding
- Re: Can I create a custom chart that shows utilization for a specific mount point/disk drive on one or more hosts?
- Subscribe to RSS Feed
- Mark Topic as New
- Mark Topic as Read
- Pin this Topic for Current User
- Printer Friendly Page
Can I create a custom chart that shows utilization for a specific mount point/disk drive on one or more hosts?
- Mark as New
- Subscribe to RSS Feed
- Permalink
30 Apr 2019
12:15 PM
- last edited on
22 Dec 2022
01:29 PM
by
![]() AgataWlodarczyk
AgataWlodarczyk
Can I create a custom chart that shows utilization for a specific mount point/disk drive on one or more hosts?
Currently chart allows to create one metric with average disk usage. No further fine tuning is allowed and I wants to watch specific mount points on dashboard. How can we achieve this?
- Labels:
-
dashboards classic
- Mark as New
- Subscribe to RSS Feed
- Permalink
15 Jan 2020 08:43 PM
It's not possible I think right now. You can add multiple time-series metrics to single chart. it's only option I have in my mind right now.
Sebastian
- Mark as New
- Subscribe to RSS Feed
- Permalink
15 Jan 2020 09:31 PM
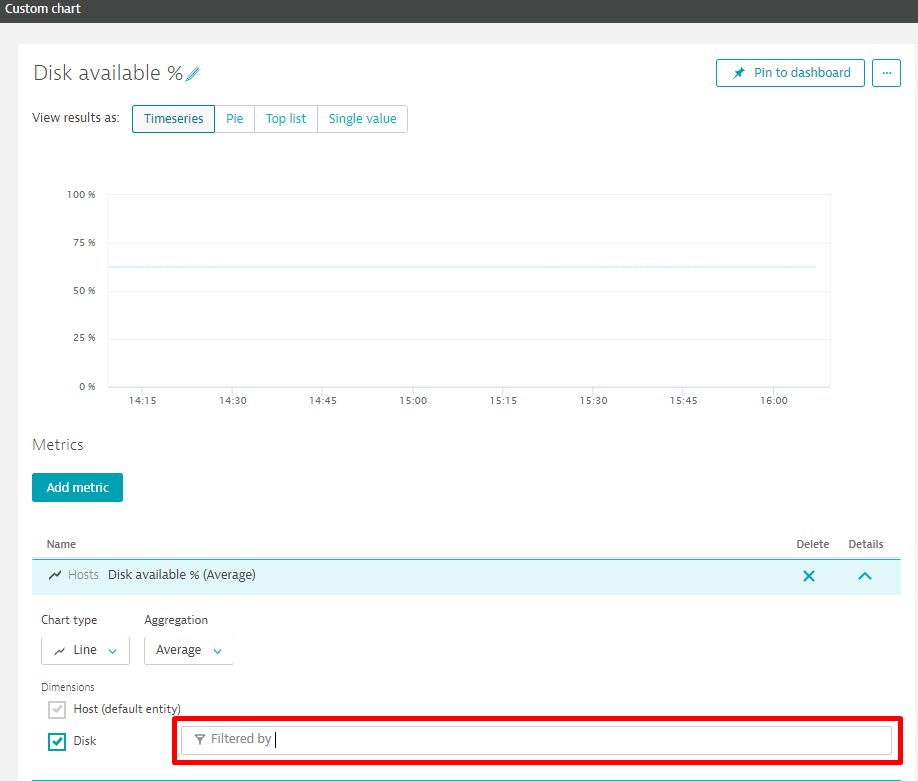
You should be able to filter down to specific disks on a host via a custom chart and then add it to a dashboard. 
- Mark as New
- Subscribe to RSS Feed
- Permalink
15 Jan 2020 11:19 PM
Problem is with „mogę host criteria”. It’s not Easy to filter Metrics this way
