- Dynatrace Community
- Ask
- Dashboarding
- Re: Dashboard for resource requests from waterfall analysis
- Subscribe to RSS Feed
- Mark Topic as New
- Mark Topic as Read
- Pin this Topic for Current User
- Printer Friendly Page
- Mark as New
- Subscribe to RSS Feed
- Permalink
10 Apr 2022
03:17 AM
- last edited on
25 May 2023
10:33 AM
by
![]() Michal_Gebacki
Michal_Gebacki
Experts,
is there a way I could create a dashboard for the top time-consuming requests (document, XHR, resource requests) from their waterfall analysis (splitting them on application->page level) captured under RUM/Synthetic monitoring?
Solved! Go to Solution.
- Mark as New
- Subscribe to RSS Feed
- Permalink
10 Apr 2022 12:48 PM
I would say that these options might help you:
- In metrics, if you search for "synthetics", you will get some of the metrics below.
- builtin:synthetic.browser.firstByte.load and builtin:synthetic.browser.event.firstByte.load are some of the metrics where you can get the First Byte (TTFB)values, which is normally the most important part for the document download
- For XHR & resource requests, it seems that no corresponding metrics exist. But some creative metric calculation might give you a good estimation, like total time minus TTFB, for instance. Or you can use composite metrics, like builtin:synthetic.browser.event.networkContribution.load
- If you want more details, you can even create metrics for a specific object. In the synthetic waterfall, in the object, click "Analyze over time", and then you will have the possibility to create a metric
- With RUM data, you have much more options. To begin with, the application tile has the information you want.
- In Metrics, you have a bunch of them. Search for "apps"
- Mark as New
- Subscribe to RSS Feed
- Permalink
11 Apr 2022 08:21 PM
Thanks Antonio for quick reply. As advised, I am trying to figure out composite metrics, but is there a documentation somewhere I could refer to that could help me code the desired query with accepted syntax/metrics.
I wanted to have the representation where time consuming resource requests for a particular user action (like loading of PDP) could be seen. We can see it under waterfall Analysis but for business reporting purpose, wanted to have a kind of dashboard.
- Mark as New
- Subscribe to RSS Feed
- Permalink
11 Apr 2022 09:02 PM
Have you checked the Data Explorer documentation pages? I include some for your reference:
- https://www.dynatrace.com/support/help/how-to-use-dynatrace/dashboards-and-charts/explorer
- https://www.dynatrace.com/support/help/how-to-use-dynatrace/dashboards-and-charts/explorer/explorer-...
- https://www.dynatrace.com/support/help/how-to-use-dynatrace/dashboards-and-charts/explorer/explorer-...
- https://www.dynatrace.com/support/help/how-to-use-dynatrace/metrics/built-in-metrics
- Mark as New
- Subscribe to RSS Feed
- Permalink
20 Jul 2022 09:41 PM - edited 20 Jul 2022 09:42 PM
Regarding RUM
I can't think of any way to get "requests" on a dashboard,. As you said, in DT currently in both cases, RUM and Synthetic, you would go to the waterfall or the page overview to find them.
Maybe something where @Jacek_Janowicz could help?
Other indirect alternatives
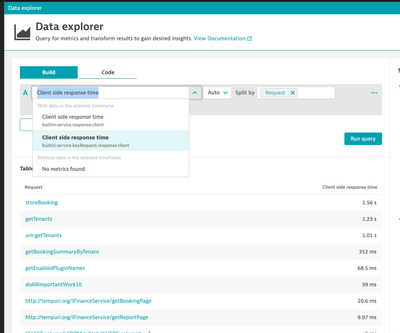
You can get a list of service requests from service metrics like (if you split by request):
Downsides:
- I would not know of a way to now filter by "application". I guess by tagging all related services yourself?
- Not sure whether this would cover all your "web/frontend" parts.
- You don't get the rich metrics of RUM/Synthetic but only a rough response time, for example
Featured Posts

