This website uses Cookies. Click Accept to agree to our website's cookie use as described in our Privacy Policy. Click Preferences to customize your cookie settings.
Dashboarding
Dynatrace dashboards, notebooks, and data explorer explained.
Turn on suggestions
Auto-suggest helps you quickly narrow down your search results by suggesting possible matches as you type.
- Community Home
- Platform
- Dashboarding
- Re: Dashboard that shows services data per host
Options
- Subscribe to RSS Feed
- Mark Topic as New
- Mark Topic as Read
- Pin this Topic for Current User
- Printer Friendly Page
Options
- Mark as New
- Subscribe to RSS Feed
- Permalink
26 Oct 2017
03:50 PM
- last edited on
29 Sep 2022
01:23 PM
by
![]() MaciejNeumann
MaciejNeumann
Hi guys,
Prospect raises a need to show all services data (response time, Failure rate, CPU, Throughput) that are running on a single machine in one dashboard.
Prospect says that in this way he can see if there are services (rather than processes) that cause the host hard time.
Is there a way to set a dashboard for that or any intention to build this kind of dashboard?
Yos @Gil G.
dynatrace certificated professional - dynatrace master partner - Matrix Soft Ware Division - Israel
Solved! Go to Solution.
Labels:
7 REPLIES 7
Options
- Mark as New
- Subscribe to RSS Feed
- Permalink
26 Oct 2017 06:00 PM
Hi Yos,
Unless I'm misunderstanding your question, I believe this is available today with Dynatrace's dashboarding capabilities paired with tagging. If you create a tag for all services on the host in which the client is interested, you can then use that tag in custom charts, as well as a services tile.
Here is how to build a custom chart: https://help.dynatrace.com/monitoring-insights/das...
You can then apply tags to that to filter to the exact services you'd like.
Hope this helps,
Hayden
Options
- Mark as New
- Subscribe to RSS Feed
- Permalink
27 Oct 2017 06:10 AM
Hi Hayden,
First thanks for your answer.
we thought about taging but.... in this case prospect got around 500 services running on one jvm. So prospect is willing to see in one dashboard which of the 500 services is causing the server/jvm a cpu/memory/failure rate/throughput issue.
not sure that taging in this case and then charting each of the 500 services will help 😞
Yos
dynatrace certificated professional - dynatrace master partner - Matrix Soft Ware Division - Israel
Options
- Mark as New
- Subscribe to RSS Feed
- Permalink
27 Oct 2017 07:32 AM
So the problem is, that the customer cannot chart 500 services on one chart or what? Splitting up the services on multiple charts? Or is the max. metric limit the problem? Please be more specific, thanks.
Options
- Mark as New
- Subscribe to RSS Feed
- Permalink
27 Oct 2017 09:42 AM
Hi Thorsten,
First of all there is no problem.
We just want to find the right way to answer prospect challenge with how he can find out which service out of his 500 that are running on one single process, consume the most of cpu, throughput, failures, memeory.
We can see this functionality in builtin process dashboard and prospect ask if there is a way to build this kind of dashboard for services.
Hope I was able to explain the need now.
Yos
dynatrace certificated professional - dynatrace master partner - Matrix Soft Ware Division - Israel
Options
- Mark as New
- Subscribe to RSS Feed
- Permalink
27 Oct 2017 01:18 PM
OK, maybe I still don't understand the problem, but I can chart the following:
Custom charting:
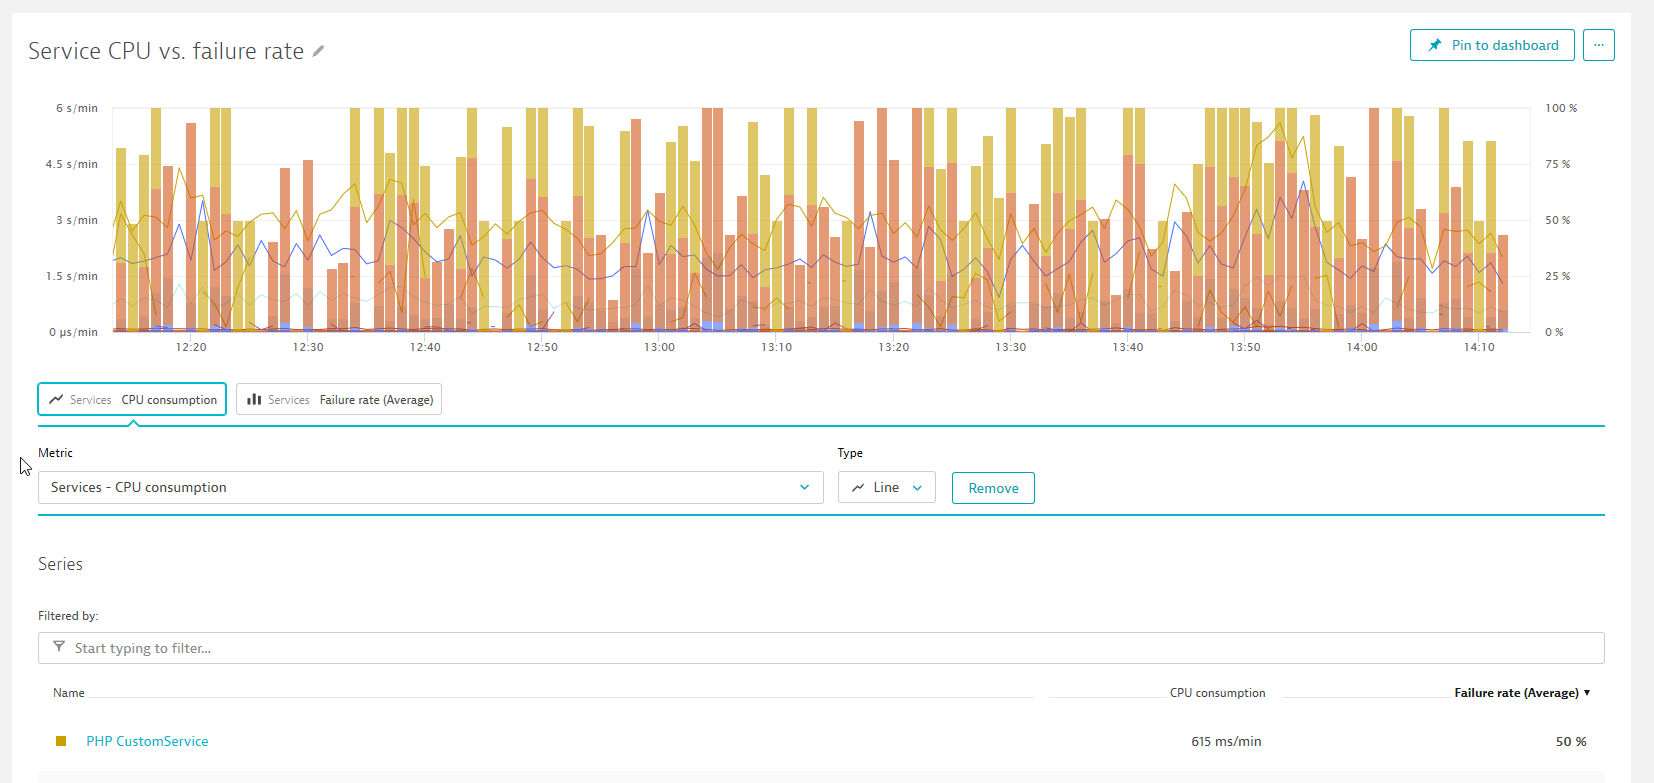
In the service overview the third button in the filter panel:
Memory is not available. Is this what you want to achieve?
Thorsten
Options
- Mark as New
- Subscribe to RSS Feed
- Permalink
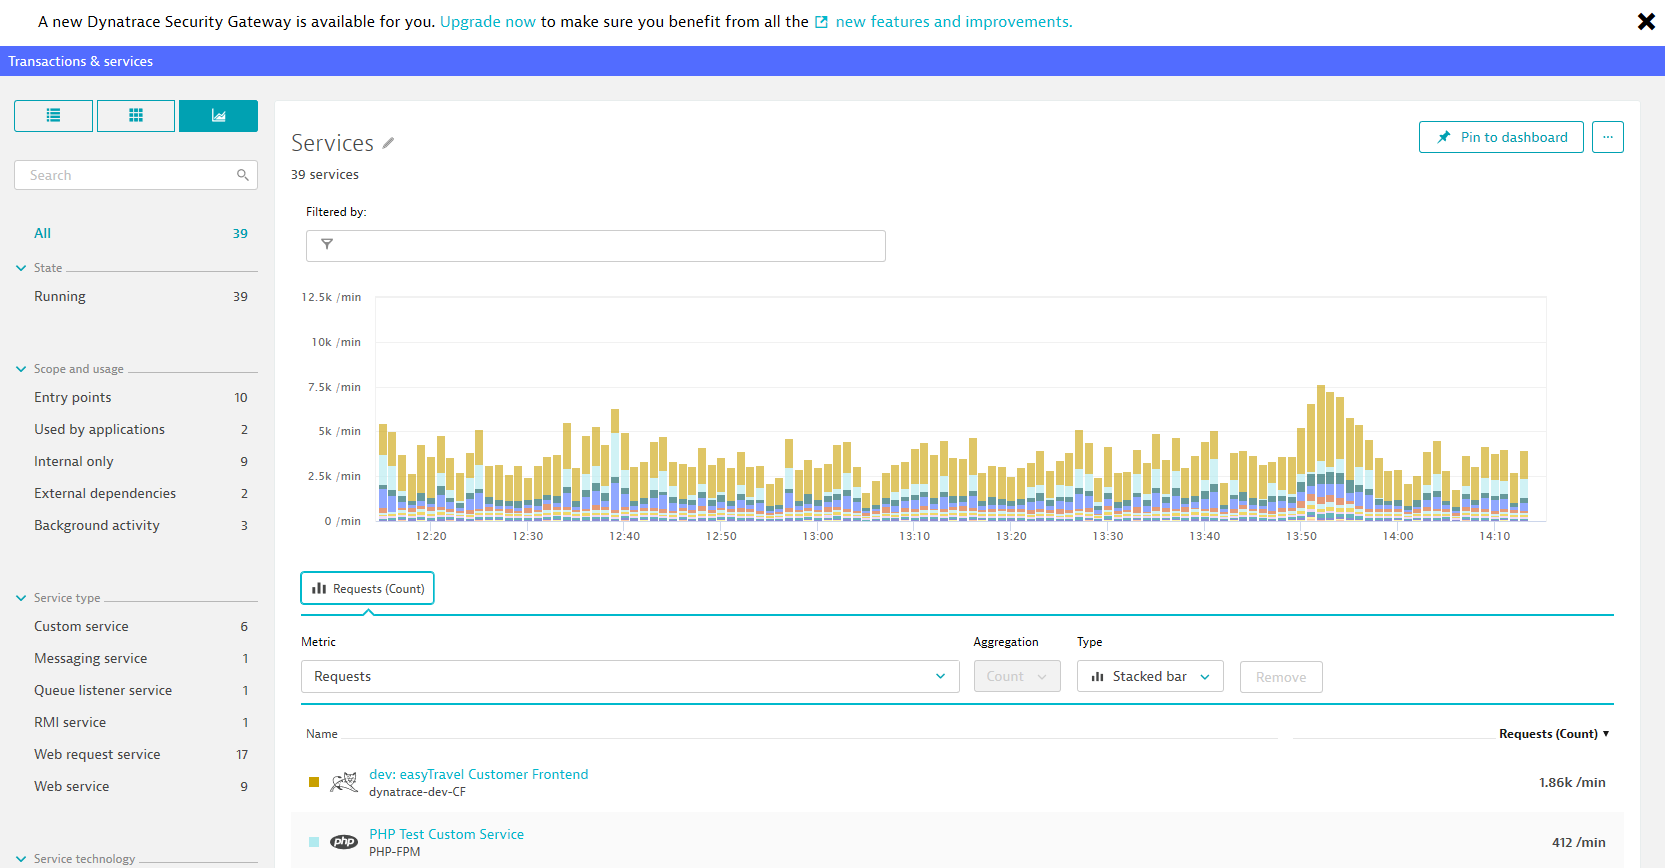
27 Oct 2017 03:17 PM
Hi Thorsten,
We have already showed prospect this services chart but they said that their services (500!) are running on one process over 5 host and from this chart of services they can't understand which service on what server is causing their problem (i.e. traffic,cpu,memory,failure rate....) nor to drill down to it.
Actually what they are looking for is extend to the provided services data under process dashboard with the data of traffic,cpu,memory,failure rate, something like the follow screenshot
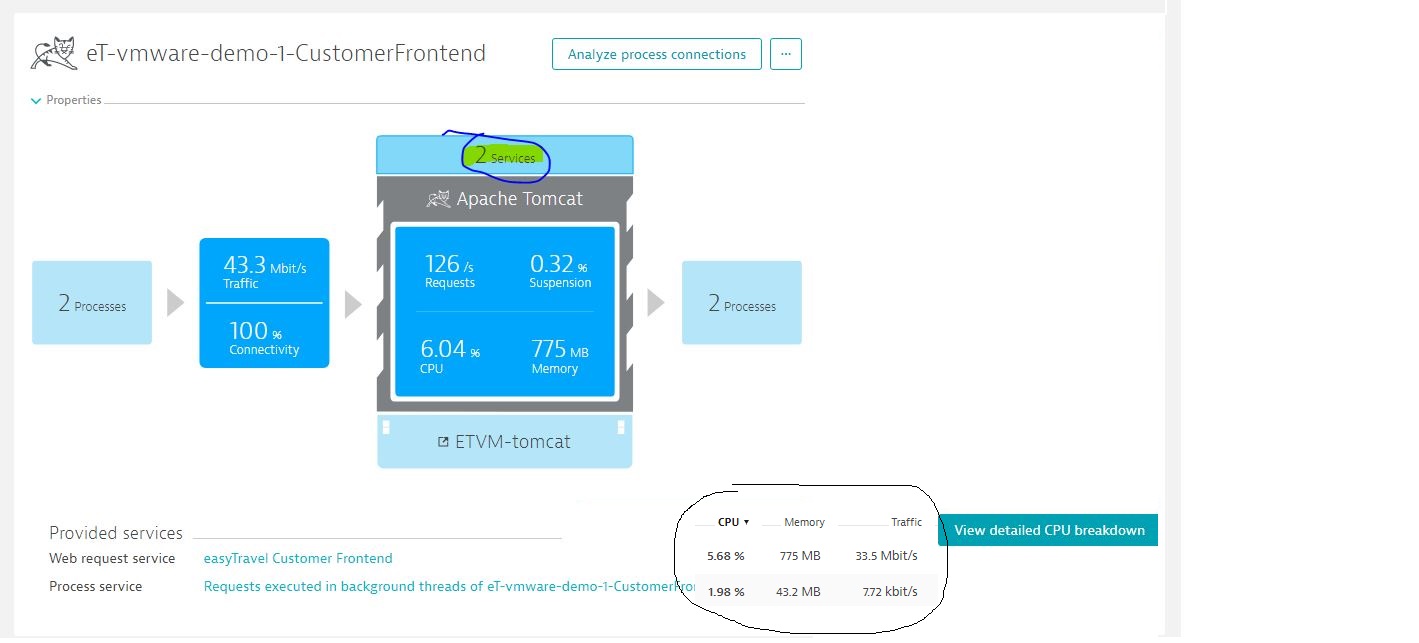
They got 500 services on their process not 2 🙂
Yos
dynatrace certificated professional - dynatrace master partner - Matrix Soft Ware Division - Israel
Options
- Mark as New
- Subscribe to RSS Feed
- Permalink
03 Dec 2017
09:41 AM
- last edited on
11 Jan 2022
01:32 PM
by
![]() AgataWlodarczyk
AgataWlodarczyk
This can now be done on click. read: https://www.dynatrace.com/blog/multi-dimensional-analysis-views-for-service-metrics-and-custom-metri...
Featured Posts
