- Dynatrace Community
- Ask
- Dashboarding
- Re: Get client requests or http requests by appliction in a timeseries graph
- Subscribe to RSS Feed
- Mark Topic as New
- Mark Topic as Read
- Pin this Topic for Current User
- Printer Friendly Page
- Mark as New
- Subscribe to RSS Feed
- Permalink
17 Dec 2019
09:07 AM
- last edited on
31 Aug 2022
10:58 AM
by
![]() MaciejNeumann
MaciejNeumann
Hi,
We want to get client requests or http requests by appliction in a timeseries graph in order to get the inactivity in an application. We want to see gaps in a graphic because there are not user action for a time.
What is the metric that gets this?
Thanks,
Elena.
Solved! Go to Solution.
- Mark as New
- Subscribe to RSS Feed
- Permalink
17 Dec 2019 10:35 AM
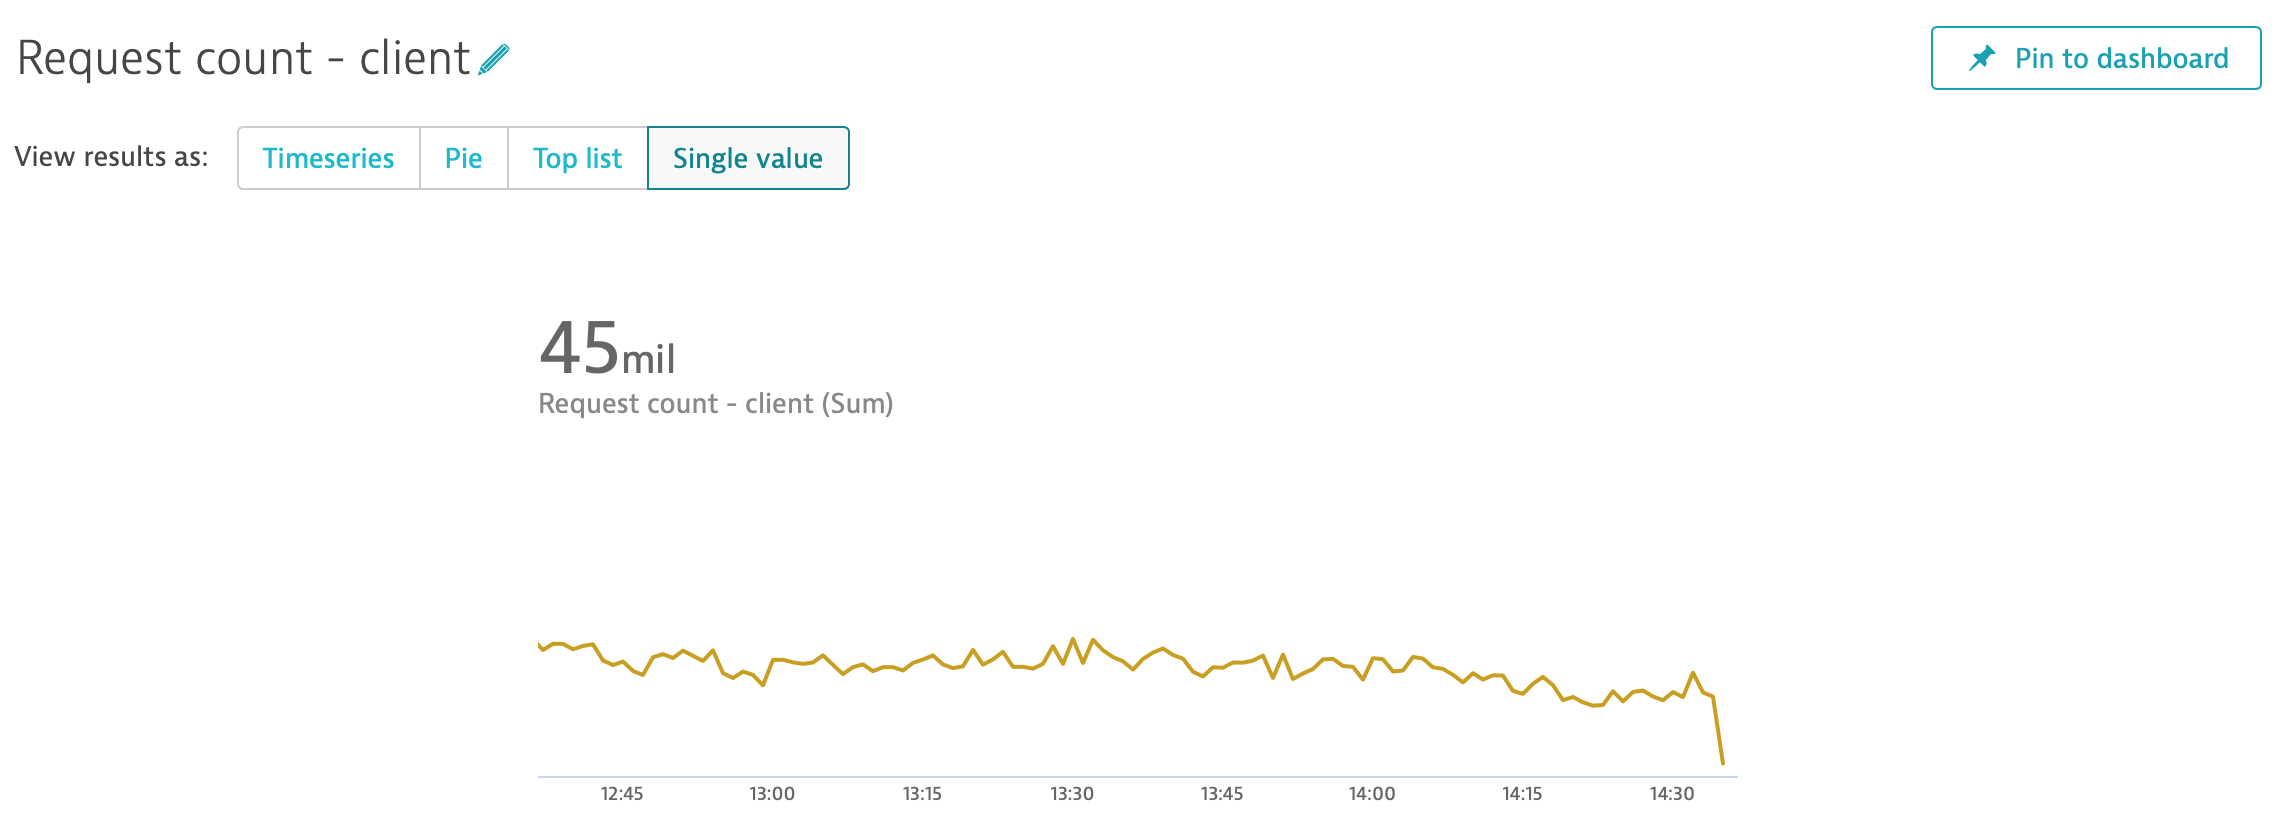
In general this may be not so easy task. You can user Service request count measure and filter services by tag (you can tag services automatically based on process it is working on) buy if those service are shered between multiple applications (it sometimes happened) you will have to use process group detection to split process group, this will as well split services. But if you don't have such option you can chart metric I've mentioned and use Single Value presentation type.
If you mean Application in dynatrace meaning, it may be hard. You can count user actions using USQL for example or built in timesries metrics (for whole application). But this has nothing to number of requests that are executed from browser. This part may be hard to count.
Sebastian
- Mark as New
- Subscribe to RSS Feed
- Permalink
17 Dec 2019 01:31 PM
Hi Sebastian,
Thanks for your answer.
We want to get the information by application, not by a service.
And we need to get a line chart not a single value.
So is not possible to get that? In this case, we'll open a RFE.
Elena.- Mark as New
- Subscribe to RSS Feed
- Permalink
17 Dec 2019 01:41 PM
You didn't mention what you mean by application.

Single value has graphical representation, so if application means for example whole tomcat you can pick measure I've mentioned, use this aggregation and you will have what you need. If application is made from multiple processes you can make it as well using proper tags as filters. But you will have count all requests from all services (you will have portion of requests that is count multiple times because single transaction is going through multiple porcesses / services). Best option is counting requests for example on nginx/apache which is in the front and only there. Then you have number of requests.
You have to remember as well about Adaptive Traffic Control, throughput you see may be smaller than it should because some of purepaths may be missed -> https://www.dynatrace.com/support/help/how-to-use-dynatrace/transactions-and-services/monitoring/ada...
This is how I would make such measurements for application (in architecture meaning).
If you mean Application in Dynatrace which is related to RUM, it's nor possible.Sebastian
Featured Posts
