This website uses Cookies. Click Accept to agree to our website's cookie use as described in our Privacy Policy. Click Preferences to customize your cookie settings.
Dashboarding
Dynatrace dashboards, notebooks, and data explorer explained.
Turn on suggestions
Auto-suggest helps you quickly narrow down your search results by suggesting possible matches as you type.
- Community Home
- Platform
- Dashboarding
- How to create chart to calculate total request within each process ?
Options
- Subscribe to RSS Feed
- Mark Topic as New
- Mark Topic as Read
- Pin this Topic for Current User
- Printer Friendly Page
Options
- Mark as New
- Subscribe to RSS Feed
- Permalink
15 Sep 2020
05:57 AM
- last edited on
31 Aug 2022
10:55 AM
by
![]() MaciejNeumann
MaciejNeumann
Hi,
I want to create custom chart to show the graph total request within process, let say I have installed oneagent in 2 different host and Dynatrace Managed detected 1 process for each host. I want to know how much total request for each process.
I still don't know what metrics to showing this data, I just see total request metrics for services (and also key request) only
Thanks
Solved! Go to Solution.
Labels:
- Labels:
-
data explorer
1 REPLY 1
Options
- Mark as New
- Subscribe to RSS Feed
- Permalink
17 Sep 2020 09:30 AM
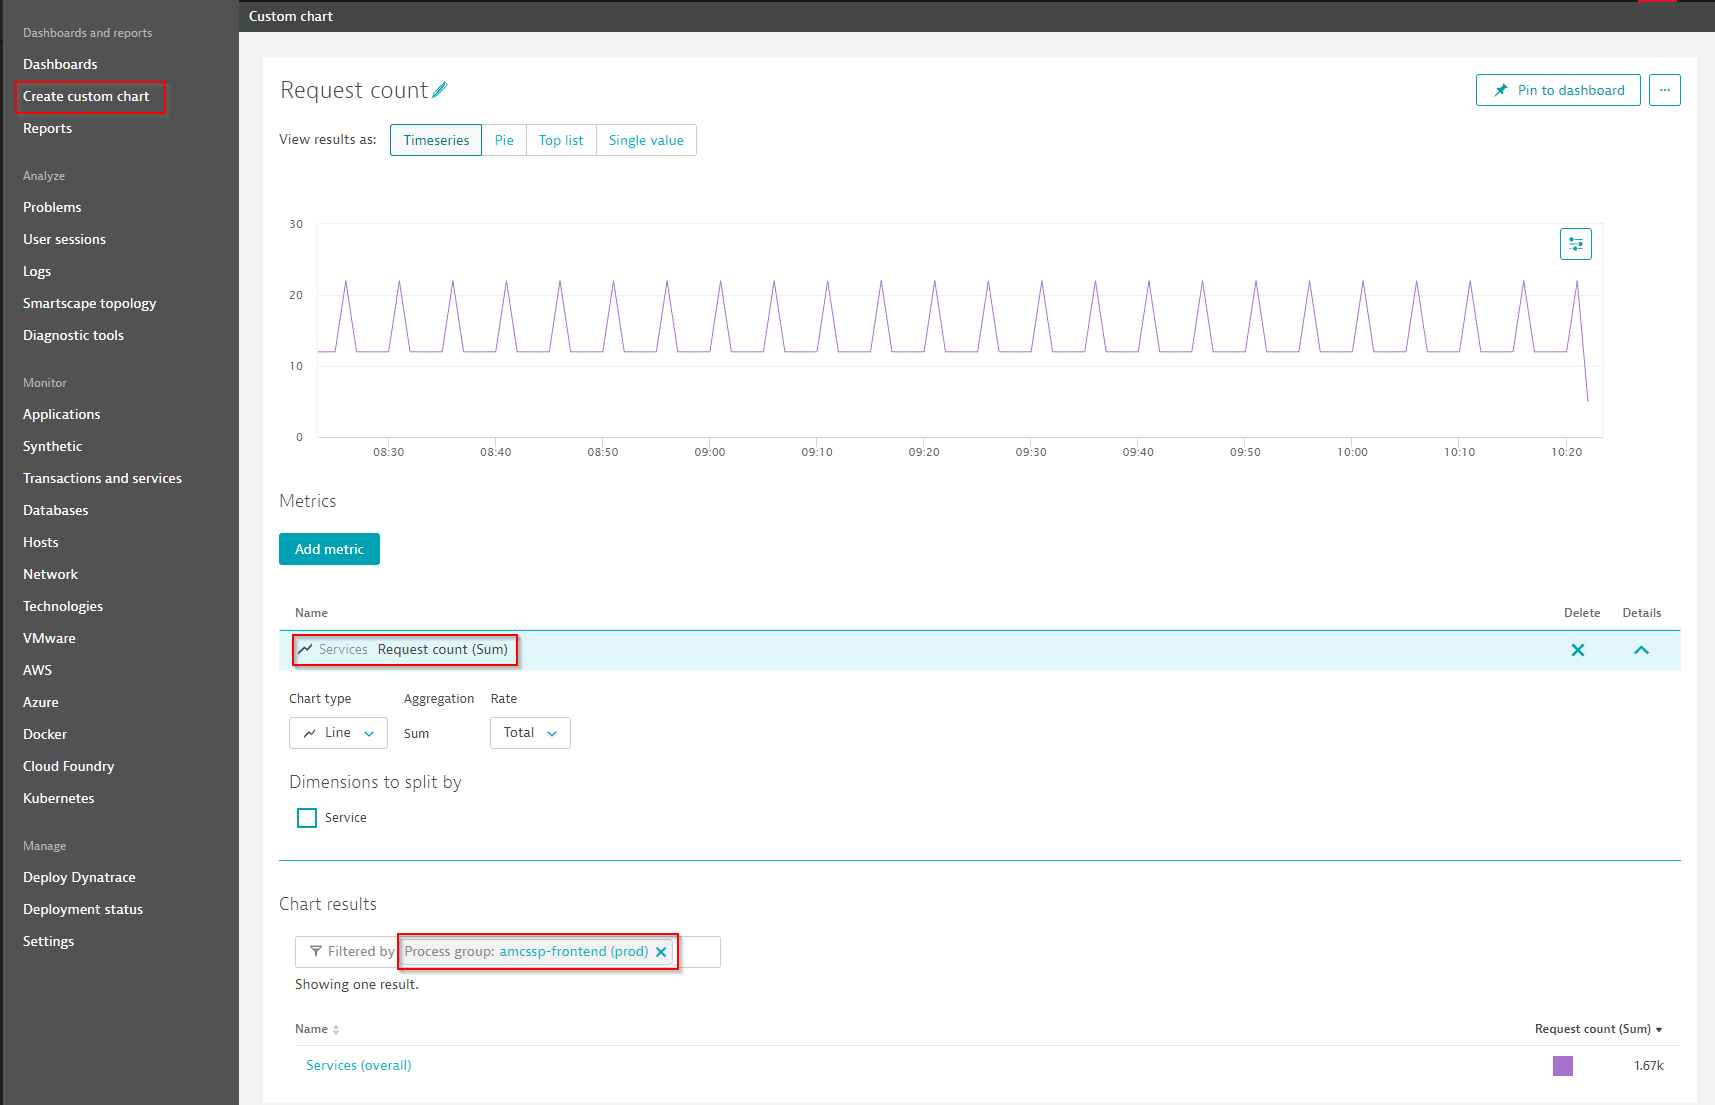
You can do it with a Custom Chart:
- Create Custom Chart
- Add Metric Request Count (Services -> Request Count)
- Filter by the specific Process Group you want
This will give you the total number of request for the processes of this specific process group over all hosts.
For more complex charts have a look at Multidimensional Analysis Charts.
Dynatrace Certified Master - Dynatrace Partner - 360Performance.net
Reply
Featured Posts
