- Dynatrace Community
- Ask
- Dashboarding
- Re: Any Exception multidimensional analysis page.
- Subscribe to RSS Feed
- Mark Topic as New
- Mark Topic as Read
- Pin this Topic for Current User
- Printer Friendly Page
- Mark as New
- Subscribe to RSS Feed
- Permalink
11 Apr 2023
07:13 AM
- last edited on
30 May 2023
07:25 AM
by
![]() MaciejNeumann
MaciejNeumann
Hello
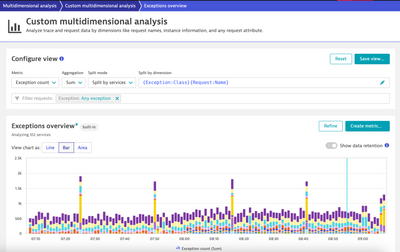
I work a lot with this page - link below. He helps me understand and monitor the problem. excellent!!
For example:
- I have a payment service name there, so I register it on the Any_Exception_multidimensional_analysis page.
- I want to transfer it to the dashboard and perform the exact search.
- How can I perform this search mode also for my dashboard and make a filter?
Solved! Go to Solution.
- Mark as New
- Subscribe to RSS Feed
- Permalink
11 Apr 2023 07:27 AM - edited 11 Apr 2023 08:44 AM
Hi,
You can apply the Exception Count measure on the dashboard with Spliting Mode: Service and Spliting by dimension: {Exception:Class} enabled. Please remember that you should to create a new measure. Then you create a new measure and add it to the tile you have pinned to your Dashboard.
Regards,
Radek
- Mark as New
- Subscribe to RSS Feed
- Permalink
11 Apr 2023 07:34 AM
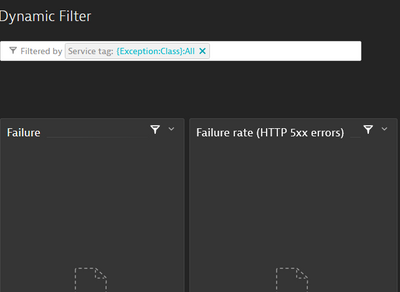
I want to do something like this and then get the results exactly like the page you and I get inside.
I want to perform the search and get the data already in the filter of the dashboard
- Mark as New
- Subscribe to RSS Feed
- Permalink
11 Apr 2023 07:43 AM
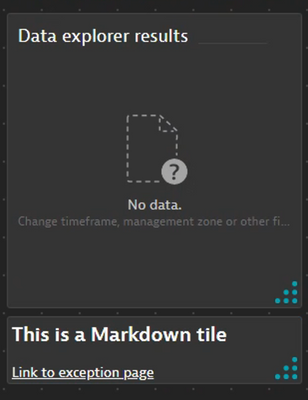
For exceptions, you won't do it that way. You can put the metric on a separate tile. Then underneath you can add a Markdown tile - you will add in it a link to your Multidimentional View with the appropriate filter.
Radek
- Mark as New
- Subscribe to RSS Feed
- Permalink
11 Apr 2023 07:49 AM
Can you send me a sample, thank you.
Or the code I need to enter in Data explorer
- Mark as New
- Subscribe to RSS Feed
- Permalink
11 Apr 2023 07:54 AM
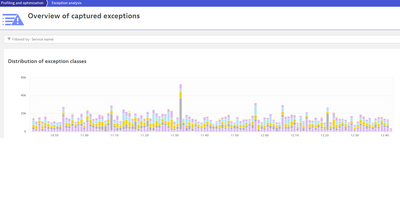
I also saw this option
Overview of captured exceptions
Is it possible to add the option to the dashboard?
- Mark as New
- Subscribe to RSS Feed
- Permalink
11 Apr 2023 08:26 AM - edited 11 Apr 2023 08:27 AM
Hey,
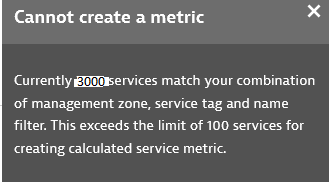
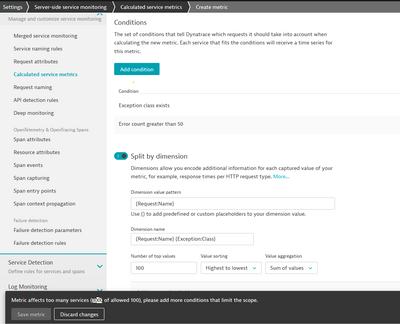
I got confused and you can use filter: Exception: Any exception. However, remember the limit on the number of dimensions for calculated metrics "This exceeds the limit of 100 services for creating calculated service metric."
In the first step, you need to create a multidimentional view:
*Remember to select the appropriate Management Zone.
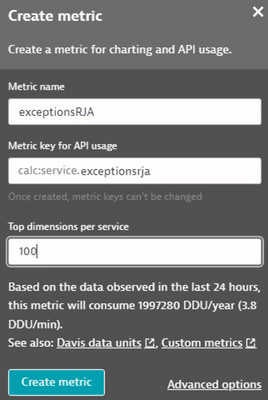
In the next step you choose Create Metric (remember the limit mentioned above).
Once the metric is created, you pin it to the dashboard of your choice (The metric collects data from the moment it is created - there will be no historical data in it)
Then under the metrics tile you add a second tile with a link to Multidimentional where you have the appropriate filter. You have to know that this metric will consume DDU's.
Sorry for the confusion with this filter:) It slipped my mind:)
Radek
- Mark as New
- Subscribe to RSS Feed
- Permalink
13 Apr 2023 11:35 AM - edited 13 Apr 2023 11:37 AM
First of all, I thank you for the help, and the answer is fast, but I don't need to produce what you wrote
I'm also trying to get a new metric but it doesn't allow me to hit the top 100 or top 10 of Serveries
Another example of I want to produce in the dashboard is like the image below
- Mark as New
- Subscribe to RSS Feed
- Permalink
13 Apr 2023 11:37 AM
Try to restrict down the data - because you are limited to a maximum of 100 services.
- Mark as New
- Subscribe to RSS Feed
- Permalink
13 Apr 2023 11:39 AM
How can I do this according to any metric
- Mark as New
- Subscribe to RSS Feed
- Permalink
13 Apr 2023 02:18 PM
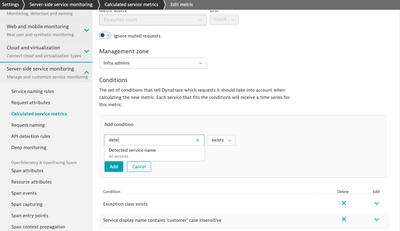
You can add new Condition to this metric to narrow the data.
- Mark as New
- Subscribe to RSS Feed
- Permalink
16 Apr 2023 08:54 AM
I appreciate your help,
I managed to download the numbers of the service But still couldn't reach 100.
It's just that there are a lot of Services in the system in the same area, and there's a lot in common in their names, so it's not easy to tell them apart,
Is it possible to do the TOP 100?
- Mark as New
- Subscribe to RSS Feed
- Permalink
18 Apr 2023 09:24 AM
https://www.dynatrace.com/support/help/observe-and-explore/metrics/built-in-metrics#services
What can I do if these metrics limit what I need?
For every condition I register by name and server marking, I reach more than 100 servers, so I can't create metrics.
- Mark as New
- Subscribe to RSS Feed
- Permalink
08 May 2023 12:22 PM
Can anyone give an answer on this??
- Mark as New
- Subscribe to RSS Feed
- Permalink
08 May 2023 09:48 PM
Hi @yuval1983
As mentioned within SSL Cheeker extension under Calculated metrics "The default limit is currently 100 so it might need to be increased to 1000 via Dynatrace One ( serviceMetricsMaxAffectedServiceLimit )."
Try to connect with DT one (via in product chat or open a support ticket) and ask to increase this limit.
HTH
Yos
Featured Posts


