- Dynatrace Community
- Dynatrace
- Ask
- Dashboarding
- Re: How to show current number of users connected to application
- Subscribe to RSS Feed
- Mark Topic as New
- Mark Topic as Read
- Pin this Topic for Current User
- Printer Friendly Page
How to show the current number of users connected to an application?
- Mark as New
- Subscribe to RSS Feed
- Permalink
05 Aug 2019
08:31 AM
- last edited on
17 Mar 2023
11:04 AM
by
![]() Ana_Kuzmenchuk
Ana_Kuzmenchuk
Hi guys
Customer wants to show current number of connected users to application.
The live session dashlet not reflecting situations like webserver is down and users cannot connect.
When using custom charts , application --> active session, and choosing single value, the number shows sum of the all average selected time farm and not the current number of connected users.
Any suggestion how to show current number of users connected to the application ?
Yos
- Labels:
-
dashboards classic
-
user sessions
- Mark as New
- Subscribe to RSS Feed
- Permalink
05 Aug 2019 08:35 AM
There is no aby other option then those you’ve mentioned right now. We are using active session chart in general, for most cases it’s ok. But this even without average aggregation will not tell you true for one 100% because sessions has some timeout before expire.
Sebastian
- Mark as New
- Subscribe to RSS Feed
- Permalink
07 Aug 2019 02:53 AM
Why don't you use User Behaviour tile on dashboard for your application, it has bar chart which will give you detail on the user count for selected time frame.
If you need only the live user count, better go for Live User Count Tile - This will give you clear number as in for current live/connected users on that very application.
- Mark as New
- Subscribe to RSS Feed
- Permalink
07 Aug 2019 06:11 AM
Hi @Akshay M.
Customer wants to show the number of concurrent connected users.
Live session counting the number of not closed sessions and not users that use right now the application.
Lets say that the web server is crashing down and users are thrown away from the application, from live session perspective you will see slow drop of live sessions over 30 minutes while customer wants to show after few minutes (4~) that there is no users connected to application any more.
User actions are good indicate for this situation but still customer wants number of users not actions to show the recovery pace. its a combination of those tow metrics but its not easy to show the concurrent number right now with dashboard.
- Mark as New
- Subscribe to RSS Feed
- Permalink
07 Aug 2019 07:04 AM
Better measure here is throughput on server side. If it drops below regular baseline you will see it. but in General when server is down you will see Dynatrace alert "Unexpected low traffic on application" because amount of user actions will drop (this is good measure as well).
Sebastian
- Mark as New
- Subscribe to RSS Feed
- Permalink
08 Aug 2019 02:59 PM
@Yos N. I looked into some solutions for your request. There are a few options but they don't hit your request 100%.
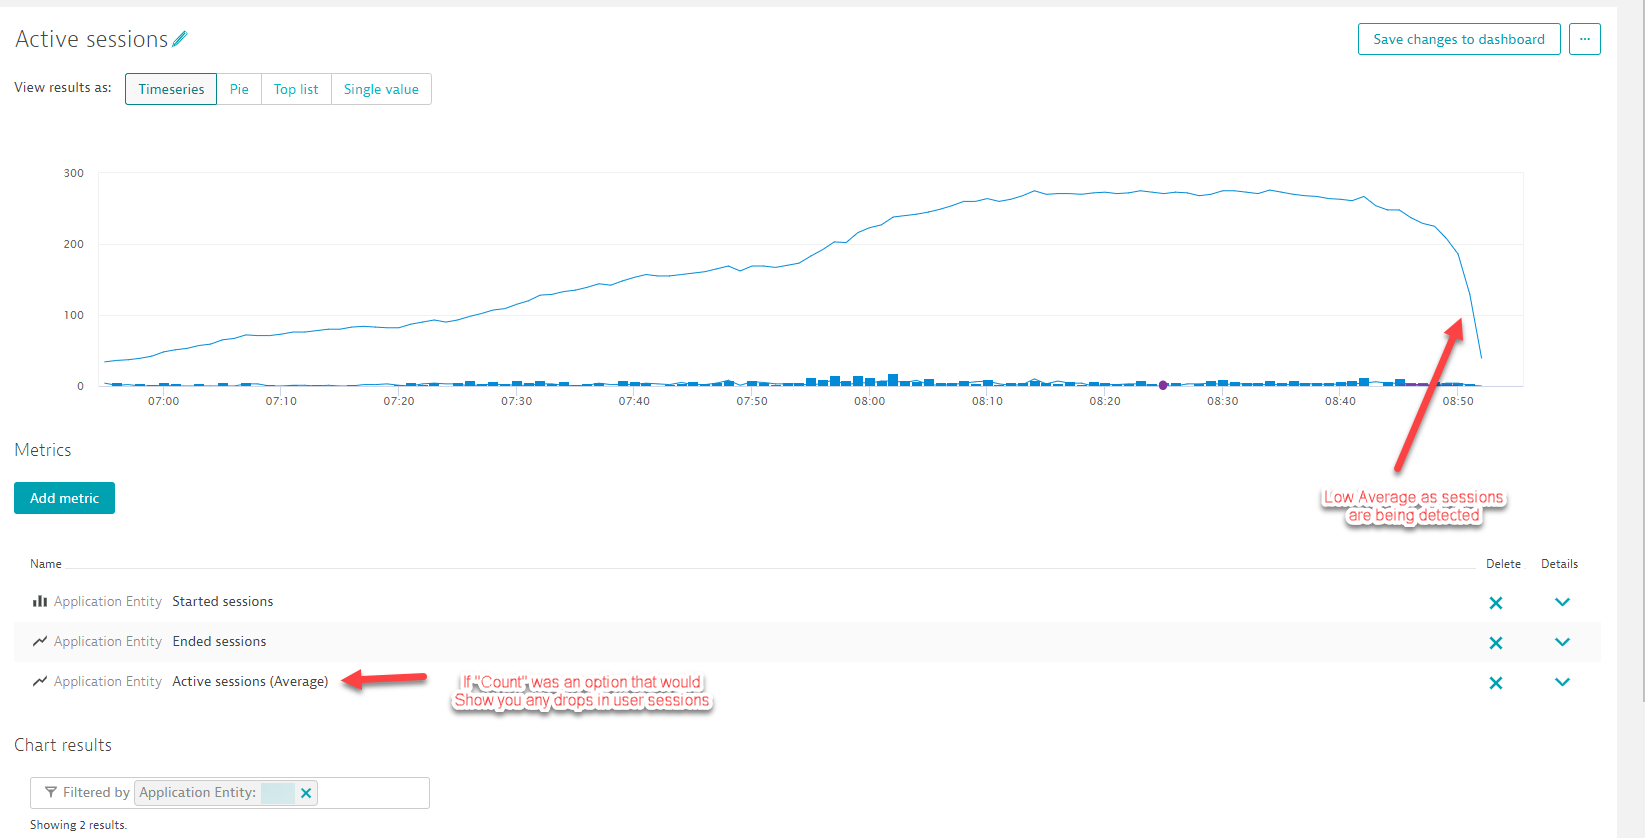
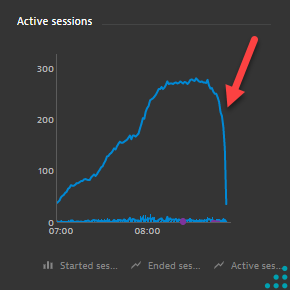
1.) You can make a custom tile that shows the Active Sessions, Started Sessions and Ended Sessions. This graph comes very close to your request but with one limitation.

The aggregation for Active Session will only use Average, If count was an option, I feel that this would give you the best visual. With Average you will see that large decline as session report back and get calcualted into the average.
This option also allows you to have a tile and select the application(s) you want graphed:

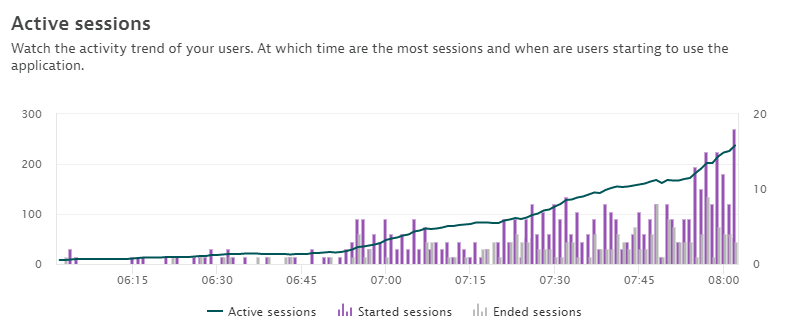
2.) Navigate to the desired Application and go into the user behavior section. In page you will see a graph that shows you the usage, but can be a few minutes behind. Also, the tile option for this isn't the best for your request.


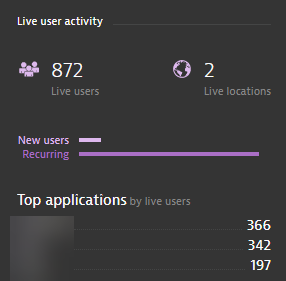
3.) Live Users tile. This tile will shoot you right into the user session section and you can continue to filter via application and such, but that tile will not retain those extra filters.

4.) User Session Query. You could build a query to chart the live session just like it was shown in the first image. But at this time user session query only supports closed/ended sessions.
Hopefully in the next few updates that custom charting aggregation metric allows you to change it from Average.
- Mark as New
- Subscribe to RSS Feed
- Permalink
08 Aug 2019 03:10 PM
Hi @Chad T.
This is a good cover of the current options we got - Thanks for the time and effort.
The only issue is around that the most of the information from UEM is based on closed sessions, hence the lack of information till the session is mark as end actually leave us a bit blind for the "last 30 minutes"
Yos
- Mark as New
- Subscribe to RSS Feed
- Permalink
08 Aug 2019 03:14 PM
correct Yoz, But If you go with option 1 it gives you live data - no 30 min. delay from closed sessions along with a better looking dashboard tile that is fully customizable. But right now we can only do average - hopefully in the next few updates we will be able to select Count as the aggregation
- Mark as New
- Subscribe to RSS Feed
- Permalink
08 Aug 2019 03:16 PM
YEP we need to wait for count here, and also for the ability to set different time frame for deshlet.
