- Dynatrace Community
- Ask
- Dashboarding
- Re: MQ Dashboard Tile Suggestion for Channel Status (Using ActiveGate)
- Subscribe to RSS Feed
- Mark Topic as New
- Mark Topic as Read
- Pin this Topic for Current User
- Printer Friendly Page
- Mark as New
- Subscribe to RSS Feed
- Permalink
18 Mar 2022
01:34 PM
- last edited on
25 May 2023
01:22 PM
by
![]() Michal_Gebacki
Michal_Gebacki
Hello,
please excuse me, if this has been previously asked, but I could not find any questions regarding the use of the appropriate dashboard tile to show MQ channel status.
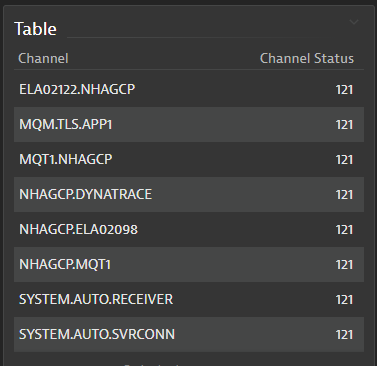
The "table" tile seems the closest but the output really does not indicate any status.
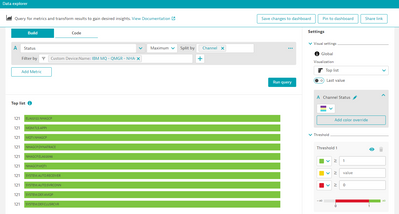
See screenshots of how I got to this. I'm not understanding the value returned under "Channel Status"
Thank you, for your consideration.
-Larry
Solved! Go to Solution.
- Labels:
-
activegate
-
dashboards classic
-
queues
- Mark as New
- Subscribe to RSS Feed
- Permalink
18 Mar 2022 01:50 PM
Hi @Larry_S , good day.
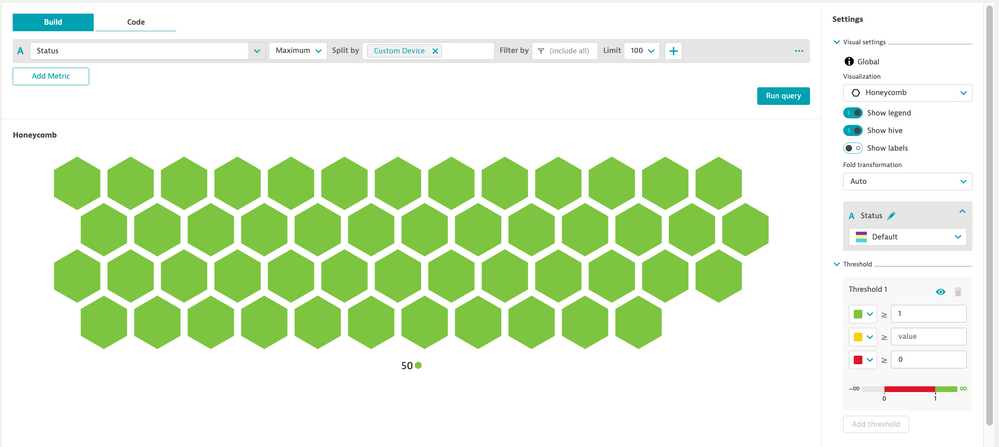
This metric provides you a simple 1/0 value status, where 1 is Status OK, and 0 is Status NOK.
My suggestion is to you change the Data Aggregation from Sum to Max, and use the honeycomb Visualization with the thresholds set to show 1 as green and 0 as red.
Let me know if this helps.
Regards.
- Mark as New
- Subscribe to RSS Feed
- Permalink
18 Mar 2022 02:14 PM
Ok. At this moment, I do not have the "Honeycomb" Visualization available to me. But I set the other to this and it shows all green
The problem is, one of the channels is Stopped and red, in this condition
Should not this one be red?
- Mark as New
- Subscribe to RSS Feed
- Permalink
18 Mar 2022 03:12 PM
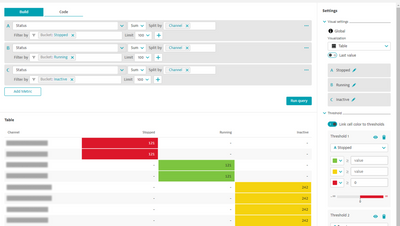
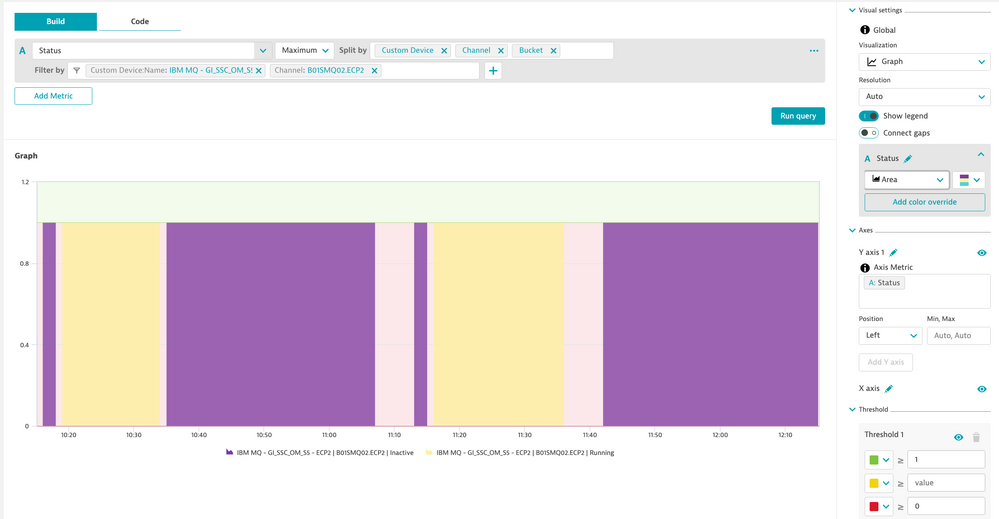
I also was not able to get the status value to appear as 1 or 0. To my knowledge, the honeycomb tile is available in cluster version 1.236. In the meantime, you might be able to get away with something like this until then.
- Mark as New
- Subscribe to RSS Feed
- Permalink
18 Mar 2022 03:19 PM
Right, I have just notice that this status has also a some others dimensions to check, such as bucket as running, inactive, stopped. so you may consider these conditions on the query.
Also, the 1/0 status I have mention can not be used since just now I figured out that the 0 value is never sent, the value is always 1, when the bucket change its status from running to stopped for example, it just leave the value for running as nothing and the stopped get the value as 1.
So you may set the filters based on what you need to get the status from, or split by bucket to get the amount of data for each status you had on the last X minutes (based on the timeframe you selected).
I don't think this metric is a good choice to use when you need a single "lastreal" value...
Featured Posts

