- Dynatrace Community
- Ask
- Dashboarding
- Questions / Limitations on Data Explorer
- Subscribe to RSS Feed
- Mark Topic as New
- Mark Topic as Read
- Pin this Topic for Current User
- Printer Friendly Page
- Mark as New
- Subscribe to RSS Feed
- Permalink
11 Dec 2020 05:38 PM
We run on a managed cluster and recently upgraded to 1.202, which includes the Data Explorer tile.
We use the old timeseries v1 api to ingest custom metrics and display them in realtime on a dashboard. When trying to replicate the functionality of displaying timerseries data we have already existing on these dashboards with the new Data Explorer and metrics v2, we run in to a couple of issues, can anyone advise if I'm doing it wrong, or address if these are known issues and will be resolved in a future release?
List of issues:
- When inputting values to the filter by tile, it does not offer autocomplete options.
- When inputting values to the filter by box, if there is a space in the name, the string must be encapsulated in quotes which is inconsistent with the rest of the tool.
- When selecting visulisations which include colour, the colour is not selectable (eg , Top List). A scheme is available but doesnt allow you to specify a colour like you can in custom chart.
- Can't change the name of the chart via the GUI. The tile will always be called "Data Explorer" unless you change it via the JSON. This is unfriendly to users who aren't comfortable with the JSON file under Advanced Settings, and is not intuitive.
- Custom Timeframes are not settable, even when setting in the JSON the custom timeframes are ignored.
- And just to nitpick! Will there be a new GUI option to access the Data explorer other than pressing "Try it out" on create custom chart, as it is not very intuitive.
Solved! Go to Solution.
- Labels:
-
dashboards classic
- Mark as New
- Subscribe to RSS Feed
- Permalink
11 Dec 2020 09:13 PM
This is great feedback, I know Dynatrace is working on some improvements but I'm not sure what the time is for the updates to it. I thought there was a feedback channel for this, but I cannot find it any more
- Mark as New
- Subscribe to RSS Feed
- Permalink
15 Dec 2020 07:02 AM
The data explorer (upcoming replacement of custom chart) made huge progress from the 1.202 (first publicly available version). Many of the issues you describe have been already addressed in recent versions (1.207/1.206). Just upgrade you managed cluster to version available ( you can't skip the upgrades anyway ).
- Mark as New
- Subscribe to RSS Feed
- Permalink
16 Dec 2020 08:53 AM
Hello @Chad T..
We found additional bug .
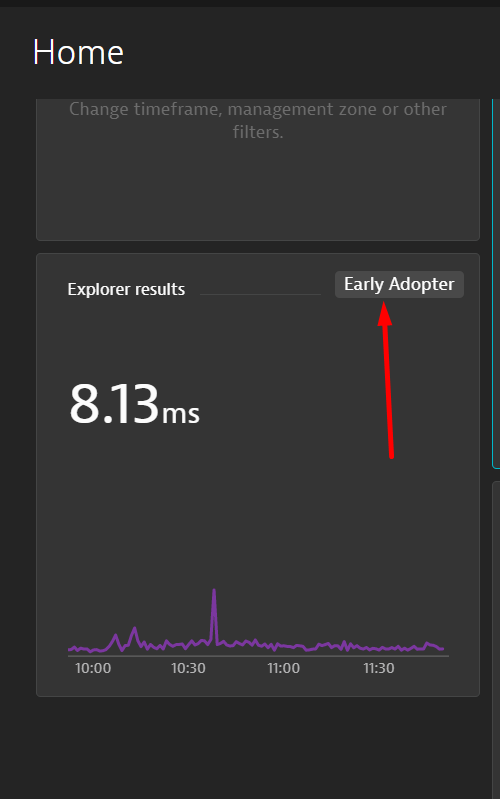
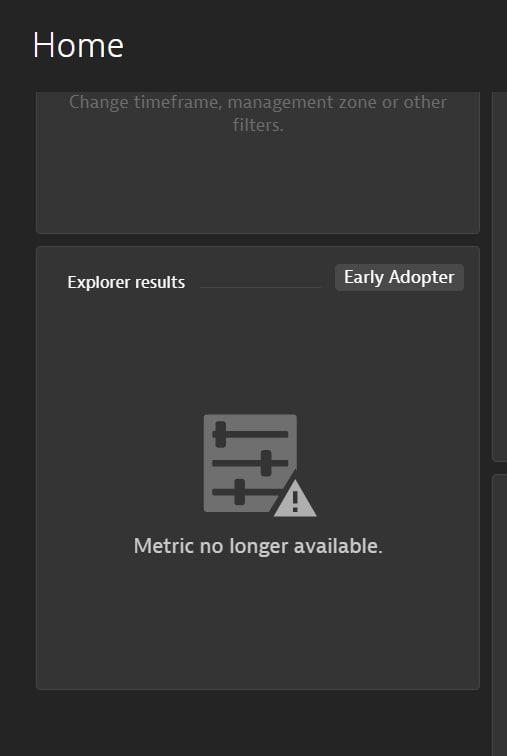
when we use a widget Data Explorer on a dashboard, and then we share this dashboard with a user without authorization, then the user does not have data for this widget.
We use 1.206.119.20201208-162938
1. my dashboard

2. Shared dashboard

Featured Posts
