- Dynatrace Community
- Ask
- Dashboarding
- Re: Data Explorer Requests per Second
- Subscribe to RSS Feed
- Mark Topic as New
- Mark Topic as Read
- Pin this Topic for Current User
- Printer Friendly Page
- Mark as New
- Subscribe to RSS Feed
- Permalink
24 Aug 2021
03:23 PM
- last edited on
31 May 2023
01:03 PM
by
![]() Michal_Gebacki
Michal_Gebacki
Hi Dynatrace team,
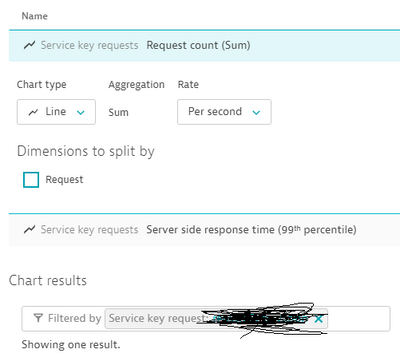
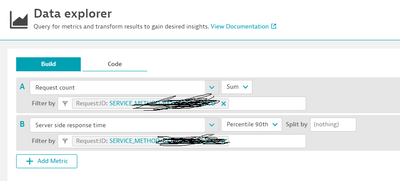
I'm trying to migrate some of my dashboards over to the new Data Explorer view but by doing so, I loose the functionality to see requests per second. Is there a way to configure this? If not, can you please add this to your road map? Our performance testing revolves around the number of requests per second we're expecting. It's also used to decide how we should scale our application when larger sale days are coming up.
Thank you,
Travis
Solved! Go to Solution.
- Labels:
-
dashboards classic
-
data explorer
- Mark as New
- Subscribe to RSS Feed
- Permalink
24 Aug 2021 07:49 PM
Hello,
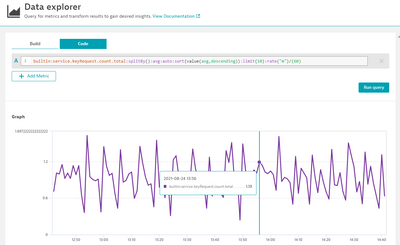
There is a way to configure this within the Data Explorer, using the 'Code' option. You are able to use the 'rate' expression to choose how the data is represented. More information on this can be found here: https://www.dynatrace.com/support/help/shortlink/api-metrics-v2-selector#rate-transformation
Additionally, you can use arithmetic with the metrics to manipulate the values. For instance, the lowest rate you can choose is Requests per Minute (using your example). We can then simply divide this metric by 60 to get our Requests per Second - as seen in the screenshot example below.
This functionality is being built for the standard 'Build' option within the Data Explorer, but has no confirmed date of release yet.
Hope this helps.
-Ryan
Dynatrace Certified Professional
- Mark as New
- Subscribe to RSS Feed
- Permalink
05 Apr 2022 06:55 PM
Hi,
We'd really like to see this on the Build tab. Has this made it into the pipeline yet?
Thanks
Dan
- Mark as New
- Subscribe to RSS Feed
- Permalink
18 Oct 2021 04:05 AM
Hi Ryan,
Thank you for your response! This makes perfect sense. I apologize for missing this response until now.
Featured Posts


