- Dynatrace Community
- Ask
- Dashboarding
- Re: Server configuration (RAM, CPU, etc.) on a dashboard
- Subscribe to RSS Feed
- Mark Topic as New
- Mark Topic as Read
- Pin this Topic for Current User
- Printer Friendly Page
- Mark as New
- Subscribe to RSS Feed
- Permalink
10 Feb 2023
08:20 PM
- last edited on
22 May 2023
02:49 PM
by
![]() Michal_Gebacki
Michal_Gebacki
I am fairly new to Dynatrace and have been looking everywhere.
Is there a way to list server configuration (RAM, CPU, #of disks, and their sizes, etc.) to post to a dashboard?
Solved! Go to Solution.
- Mark as New
- Subscribe to RSS Feed
- Permalink
13 Feb 2023 02:52 PM
Hi @mrecek, and welcome! You can check out this documentation, maybe it will help 😊 Cheers!
- Mark as New
- Subscribe to RSS Feed
- Permalink
15 Feb 2023 01:11 PM
Thank you for your reply. I found all how do show system usage (CPU %, RAM %, etc). What I'm being asked to do is display currently configured(installed) RAM, #of cores, a list of drives and their sizes. Unfortunately the only thing I have been able to display is Installed RAM. I am unable to figure out the others.
Is it possible to do this?
- Mark as New
- Subscribe to RSS Feed
- Permalink
02 Jun 2023 01:53 PM - edited 02 Jun 2023 02:03 PM
The way to go for a dashboard is to know whether a metric exists and which you can use to cover your case.
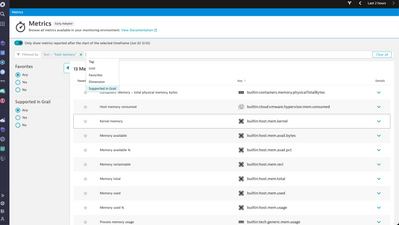
They're listed https://www.dynatrace.com/support/help/observe-and-explore/metrics/built-in-metrics, and you can use the "Metrics" app to browse all available ones.
For example, looking for memory give me:
These metrics then come with dimensions such as "host". If you split any of the metrics by host, you get the host name with a link to our pre-generated host page, for example.
What you could do is either split all the relevant metrics and get tables or multiple entries for them per chart.
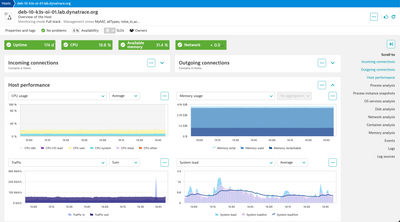
Or you create a single entity dashboard by adding a "host" filter on top of a dashboard and then selecting the individual host. But I would not suggest this since there is its own host page that might already contain most of the information you listed.
1) select the host you want to look at
2) use the host page as a - so to speak - predefined dashboard for that host
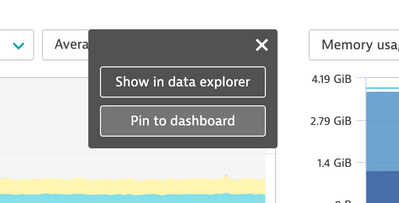
All of these metrics you can then easily also pin to a dashboard
For disks
For disks you can get a disk / volume / partition size if you are using the disk extension (com.dynatrace.extension.disk-devices.disk.size ). If not, you can calculate it as sum of builtin:host.disk.avail and builtin:host.disk.used .
For Dashboards classic
So 2 out of 4 mentioned can be retrieved. For others, we can recommend sending those metrics via the, dynatrace_ingest and to use it on dashboards calssic as well.
Entities with the new Dashboards app
Some entity information, such as tags, configurations, etc., are only available via the entities API and can't be directly put on a dashboard classic. Entity information, however, can be queried using Grail and the new Dashboards app.
I hope that helps to get further. Let me know if we can help you more.
Featured Posts


