- Dynatrace Community
- Ask
- Dashboarding
- Re: Visualizations - Code Response
- Subscribe to RSS Feed
- Mark Topic as New
- Mark Topic as Read
- Pin this Topic for Current User
- Printer Friendly Page
Visualizations for code response
- Mark as New
- Subscribe to RSS Feed
- Permalink
30 Dec 2022
06:09 PM
- last edited on
23 May 2023
09:28 AM
by
![]() Michal_Gebacki
Michal_Gebacki
I took example 2 from here, made it work for my environment. There are events returned and placed into the dataFrame.
Add code to a dashboard | Platform Docs (dynatrace.com)
But after the RunQuery, there are no Visualizations that can be used.
How can I visualize the values returned?
- Labels:
-
dashboards classic
-
data ingest
- Mark as New
- Subscribe to RSS Feed
- Permalink
02 Jan 2023 07:59 AM
Hi Stephen,
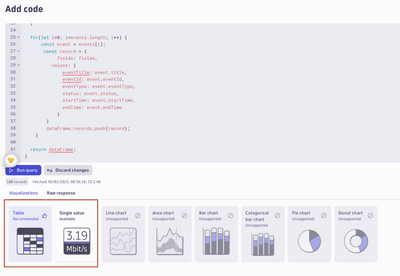
If your code returns the same data structure as explained in the docs you linked, you should see two visualization options available:
If this is not the case, can you maybe share your code snippet here (without API-Tokens) and am I happy to check what's the issue.
Christian
- Mark as New
- Subscribe to RSS Feed
- Permalink
03 Jan 2023
09:22 PM
- last edited on
25 Apr 2023
08:37 AM
by
![]() MaciejNeumann
MaciejNeumann
// Not the real URL
const environment = "https://{environmentid}.live.dynatrace.com/"
const token =
const params = 'api/v2/events';
const uri = environment+params;
const response = await fetch(uri, {
headers: {
Accept: "application/json",
Authorization: "Api-Token " + token
}})
return await response.json()
}
export default async function () {
const response = await getEvents();
const events = response.events;
const fields = [
{ name: 'eventId', type: 'string' },
{ name: 'eventType', type: 'string' },
{ name: 'status', type: 'string' },
{ name: 'eventTitle', type: 'string' },
{ name: 'startTime', type: 'timestamp' },
{ name: 'endTime', type: 'timestamp' }
];
// Create a new empty data frame for the result
const dataFrame = {
notifications: [],
records: []
}
for(let i=0; i<events.length; i++) {
const event = events[i];
const record = {
fields: fields,
values: {
eventTitle: event.title,
eventId: event.eventId,
eventType: event.eventType,
status: event.status,
startTime: event.startTime,
endTime: event.endTime
}
}
dataFrame.records.push(record);
}
return dataFrame;
}
- Mark as New
- Subscribe to RSS Feed
- Permalink
12 Jan 2023 02:24 PM
Can you please provide us with a screenshot of what the selection looks like?
regards
Thomas
- Mark as New
- Subscribe to RSS Feed
- Permalink
13 Jan 2023 03:41 PM
Hi
I'm not sure what you mean by selection?
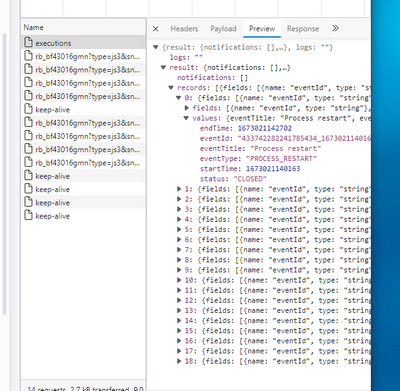
Here is a snapshot of the results.
- Mark as New
- Subscribe to RSS Feed
- Permalink
23 Feb 2023 02:56 PM
Hey! Big Sorry! I totally missed your response here. Can you provide a screenshot from your dashboard app where you entered the exampel and where you don't see any visualization suggestions. Also the code response would be interesting.
- Mark as New
- Subscribe to RSS Feed
- Permalink
04 Jan 2023 08:32 AM
Hi Stephen,
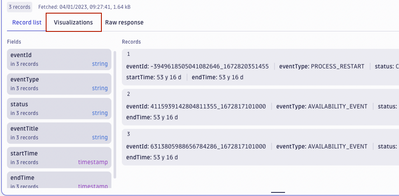
I am sorry, but I can't reproduce your issue. If I take the code you sent me and execute it in my environment, I do get results back. Initially, it's visualized in a "Record List". Do you have some results within the Record List?
When I switch to the "Visualizations" tab, I have the possibility to select either the Table or the Single Value visualization.
- Mark as New
- Subscribe to RSS Feed
- Permalink
06 Jan 2023 04:24 PM
Hi
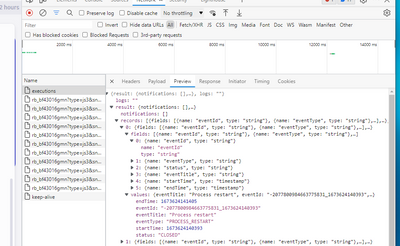
I turned on the browser tools and under preview I do seem some records and event data.
But I'm still unable to visualize the results.
Is there perhaps a version or permissions issue?
Thank you
- Mark as New
- Subscribe to RSS Feed
- Permalink
17 Jan 2023 10:24 AM
Hi Stephen,
Sorry for the late reply. I have identified the issue you're having. When the code block is too large, you can't scroll down to the visualization options. This is a bug in the currently deployed version of Dashboards. We have already fixed this and will deploy this to your environments within the next few days. I'll update you when this is done.
Sorry for the inconvenience.
Christian
- Mark as New
- Subscribe to RSS Feed
- Permalink
21 Feb 2023 11:49 PM
Hey Christian!
I am having a similar issue. I am using the same code as in the example, and I see the visualization options but it says the table option is unsupported and can't be selected. The raw data looks as expected. Preview version is v0.13.1. Is there a newer one that allows those options to be used?
thanks!
- David


