- Dynatrace Community
- Ask
- Dashboarding
- Re: Which metric hold the information regarding mobile current/live users count?
- Subscribe to RSS Feed
- Mark Topic as New
- Mark Topic as Read
- Pin this Topic for Current User
- Printer Friendly Page
- Mark as New
- Subscribe to RSS Feed
- Permalink
13 Apr 2022
03:08 PM
- last edited on
24 May 2023
03:58 PM
by
![]() Michal_Gebacki
Michal_Gebacki
Hi guys,
Customer ask to put the number of current users of a mobile app on the data explorer tile in order to give it some nice colors and size it to fit a NOC dashboard but we didn't find anywhere a metric for that...
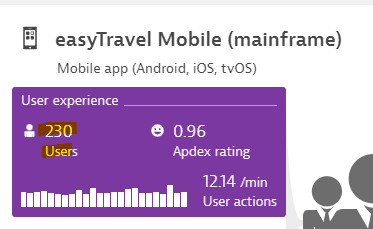
The information is shown in the Mobile infographic
And in Mobile tile
But we could not find this information in any metric. Can you guys help and explain where is this missing metric?
All the best and stay safe
Yos
Solved! Go to Solution.
- Mark as New
- Subscribe to RSS Feed
- Permalink
21 Apr 2022 06:16 PM
Hi @Yosi_Neuman
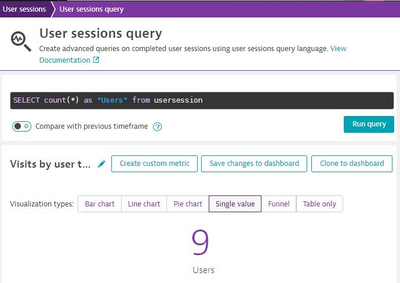
you can define such a tile for a dashboard using USQL, for the user with e.g.:
select count(*) as "Users" from usersession
You can run that under User sessions > User sessions query and once you are happy with the result on that page you will be able to pin the result to a dashboard.
Best,
Mark
- Mark as New
- Subscribe to RSS Feed
- Permalink
21 Apr 2022 08:34 PM
@mark_bley this is not the desired value. The dashboard tile shows active users. The USQL will show results from finished sessions only. That's a different value and it will never match.
- Mark as New
- Subscribe to RSS Feed
- Permalink
21 Apr 2022 10:22 PM
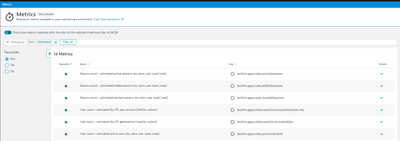
That is correct, then maybe the metrics you are looking for could be builtin:apps.other.userCount.osAndVersion-std or builtin:apps.other.userCount.osAndGeo
- Mark as New
- Subscribe to RSS Feed
- Permalink
21 Apr 2022 10:35 PM
Unfortunately, no values of those metrics do not match the value on the infographic and dashboard tile. I get 3x the value from the metric compared to the value on the infographic.
- Mark as New
- Subscribe to RSS Feed
- Permalink
21 Apr 2022 10:58 PM
I get very close (off by 1) with following query
builtin:apps.other.userCount.osAndVersion-std:filter(and(in("dt.entity.device_application",entitySelector("type(mobile_application),entityName.equals(~"<APP_NAME>~")")))):splitBy():value:auto:sort(value(sum,descending)):limit(100)
- Mark as New
- Subscribe to RSS Feed
- Permalink
22 Apr 2022 01:39 AM
There is no clear answer hear as Dynatrace does not actually expose the live sessions, it is 'in memory' only and the values you see on the application and user sessions screen under 'live' are not retrievable via usql or metrics.
There are 2 options,
1. As mentioned above, use usql
This is going to have to be delayed data (e.g what happened last hour) based on the completion of user sessions, so will never be entirely accurate for what you want, since it's only going to give you closed sessions.
example queries below.
SELECT count(distinct UserId) as 'Current Unique UserID' FROM usersession
Where useraction.application IN ("xxx") and userId IS NOT NULL
SELECT count(distinct UserId) as 'Sessions with Errors' FROM usersession
Where useraction.application IN ("xxx") and userId IS NOT NULL and useraction.requestErrorCount > 0
2. The better alternative is to use the inbuilt calculated metrics
builtin:apps.web.activeUsersEst
builtin:apps.web.activeSessions
builtin:apps.other.userCount.osAndVersion-std
These will give you Dynatrace pre calculated 'estimated' number of active users and sessions. it is split between mobile & web, so you might need to show this data separately.
Anyway, good luck
- Mark as New
- Subscribe to RSS Feed
- Permalink
22 Apr 2022 07:30 AM - edited 22 Apr 2022 07:47 AM
@gopher I don't think the value is "in memory only", since it's not the actual value. If you change the time frame, the value changes.
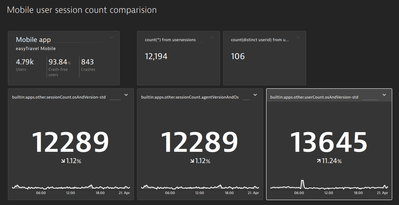
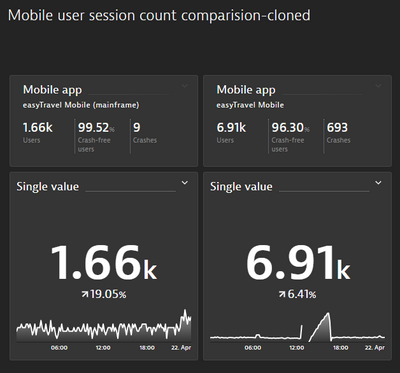
For illustration this is a sample dashboard in the Demo environment (link😞
Time frame is set to yesterday in the screenshot. You can see the metrics mentioned above by @mark_bley have the same value (expected). It's roughly the count of user session using USQL (expected). The number of users is higher (third metric).
However, you can see a significant difference between the mobile app tile value and other values. For days before yesterday, I can see an even bigger difference (4.8k vs 12k).
@Yosi_Neuman were you able to find the source? I start suspecting the value in the tile and infographic is wrong.
- Mark as New
- Subscribe to RSS Feed
- Permalink
22 Apr 2022 08:15 AM
IMO /rest/startscreen/data/MOBILE_APPLICATION is looking as the "The Usual Suspects" here.
HTH
Yos
- Mark as New
- Subscribe to RSS Feed
- Permalink
22 Apr 2022 08:18 AM
Sure it is, but that's only a facade. It does not reveal the actual data source.
- Mark as New
- Subscribe to RSS Feed
- Permalink
22 Apr 2022
08:31 AM
- last edited on
29 May 2023
09:34 AM
by
![]() MaciejNeumann
MaciejNeumann
It is working for me also on the demo tenant, please find here (https://demoid.live.dynatrace.com/#dashboard;id=8b22ceb7-2857-45a5-93d8-86639ab251c0;gtf=defaultTimeFrame;gf=defaultManagementZone) an internal link to the dashboard or the public one here (https://demoid.live.dynatrace.com/dashboards/8b22ceb7-2857-45a5-93d8-86639ab251c0?auth=dt0c01.I3I7LJHTUYYUQHEHKXZDBK3G.DBBJKHB3MGDJ6OAJB5HII4SUOD22PLLVSQE3ZFJBDFMTN5JAD5352IC64LNTHLSE)
The queries used are:
builtin:apps.other.userCount.osAndVersion-std:filter(and(in("dt.entity.device_application",entitySelector("type(mobile_application),entityId(~"MOBILE_APPLICATION-773D0C09E8E14B58~")")))):splitBy():value:auto:sort(value(sum,descending)):limit(10)
Best,
Mark
- Mark as New
- Subscribe to RSS Feed
- Permalink
22 Apr 2022 09:48 AM
Ok, yes. I focused on the sessions metrics. I agree this is finally the same metric as in the tile.
Still curious how the metric (builtin:apps.other.userCount.osAndVersion-std) is calculated as it seems it does not match the count of users using USQL or sessions.
- Mark as New
- Subscribe to RSS Feed
- Permalink
22 Apr 2022 09:51 AM
Hi Mark, can you please explain, how this metric (and similarly, web metric estimated user count builtin:apps.web.activeUsersEst) is calculated ?
Thanks
Rasto
- Mark as New
- Subscribe to RSS Feed
- Permalink
22 Apr 2022 11:34 AM
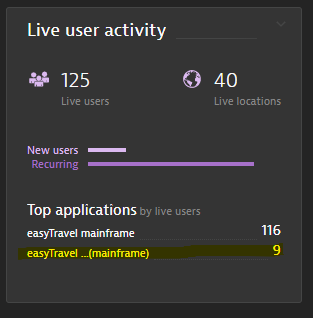
Thank you @mark_bley & @Julius_Loman for helping out and find the way to show the number of mobile users as shown in mobile application and tile from a metric, but your answer Mark raised another question ![]() regrading which metric holds the information that Live user activity tile shows
regrading which metric holds the information that Live user activity tile shows
And when drill down into this tile and split them by application is shows the live session
Is there a metric that holds this information too that we can put on a dashboard?
Thanks in advance
All the best and stay safe
Yos
- Mark as New
- Subscribe to RSS Feed
- Permalink
22 Apr 2022 01:23 PM
Hi @Yosi_Neuman,
I am afraid at the moment there is no way to recreate that exact metric since there is no dimension (or USQL parameter) to filter out live sessions. See here for more information
Featured Posts
