- Dynatrace Community
- Ask
- Dynatrace API
- Re: How to retrieve Host Availability metrics via REST API
- Subscribe to RSS Feed
- Mark Topic as New
- Mark Topic as Read
- Pin this Topic for Current User
- Printer Friendly Page
- Mark as New
- Subscribe to RSS Feed
- Permalink
11 Mar 2018
01:00 PM
- last edited on
24 May 2021
03:15 PM
by
![]() MaciejNeumann
MaciejNeumann
Hi,
In our environment, we have a requirement to extract the Host last reboot time from AppMon, as well as Dynatrace (Managed). I have been able to do so via a REST API call for AppMon, but Dynatrace Managed appears to be more challenging.
In Managed, I see in the GUI that the Uptime is recorded when looking at the Host details, but this is very vague (e.g. Uptime: over 183 days). My next thought was to consider pulling the availability metrics for a process (*NIX: systemd process, Windows: System process) as this does provide a specific time in the GUI as to when the last downtime occurred (e.g. 5 h 18 min
total downtime Last downtime on 21-02-2018 07:24 - 07:25).
Is there a way that one can retrieve this via a REST API call? Has anyone done this before?
Solved! Go to Solution.
- Labels:
-
dynatrace api
- Mark as New
- Subscribe to RSS Feed
- Permalink
12 Mar 2018 08:59 AM
You can pull the host availability metric from the Dynatrace REST API:
com.dynatrace.builtin:host.availability
https://www.dynatrace.com/support/help/dynatrace-api/timeseries/how-do-i-fetch-the-metrics-of-monitored-entities/#available-timeseries
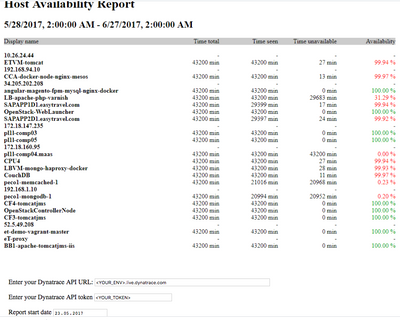
Here is a good example of a HTML process and host availability report fetched by API that calculates the same numbers as our Web UI shows:
https://github.com/Dynatrace/dynatrace-api/tree/ma...
Best,
Wolfgang
- Mark as New
- Subscribe to RSS Feed
- Permalink
12 Mar 2018 12:15 PM
Thanks Wolfgang, I will try this.
- Mark as New
- Subscribe to RSS Feed
- Permalink
23 Jun 2021 02:37 PM - edited 23 Jun 2021 02:52 PM
Hello
Please could you help to build something as shown in the git hub (from scratch please)?
How Can I have a view like bellow with simply API
- Mark as New
- Subscribe to RSS Feed
- Permalink
06 Sep 2019 10:14 AM
@Wolfgang B. will process and host availability be added to the api v2 soon?
- Mark as New
- Subscribe to RSS Feed
- Permalink
09 Sep 2019 12:17 PM
Yes we will add it pretty soon.
- Mark as New
- Subscribe to RSS Feed
- Permalink
17 Apr 2020 08:51 PM
is it added in api v2?
- Mark as New
- Subscribe to RSS Feed
- Permalink
23 Apr 2020 02:03 PM
not so far but we will not forget about that
- Mark as New
- Subscribe to RSS Feed
- Permalink
23 Mar 2021 10:43 AM
Any updates on this?
- Mark as New
- Subscribe to RSS Feed
- Permalink
24 Jul 2023 09:09 AM
I've been looking for this one, but I can't find it in v2. Is this implemented? I really need this information.
Featured Posts

