- Dynatrace Community
- Learn
- Dynatrace tips
- Re: Dynatrace SaaS Audit logs
- Subscribe to RSS Feed
- Mark Topic as New
- Mark Topic as Read
- Pin this Topic for Current User
- Printer Friendly Page
- Mark as New
- Subscribe to RSS Feed
- Permalink
16 Jan 2020
01:56 PM
- last edited on
04 Sep 2023
10:19 AM
by
![]() MaciejNeumann
MaciejNeumann
- Mark as New
- Subscribe to RSS Feed
- Permalink
16 Jan 2020 02:03 PM
Yes it does at long last! 🙂 Trying to figure out the best way now to pull them into Splunk.
- Mark as New
- Subscribe to RSS Feed
- Permalink
16 Jan 2020 02:07 PM
let me know how that goes as we have splunk too
- Mark as New
- Subscribe to RSS Feed
- Permalink
16 Jan 2020 02:09 PM
Will do. Going to start trying to figure it out today.
- Mark as New
- Subscribe to RSS Feed
- Permalink
16 Jan 2020 02:03 PM
You can now audit the following:
- Login events
- Logout events
- Any change to a configuration
- Any change to API tokens
To enable and use the new environment Audit logs API
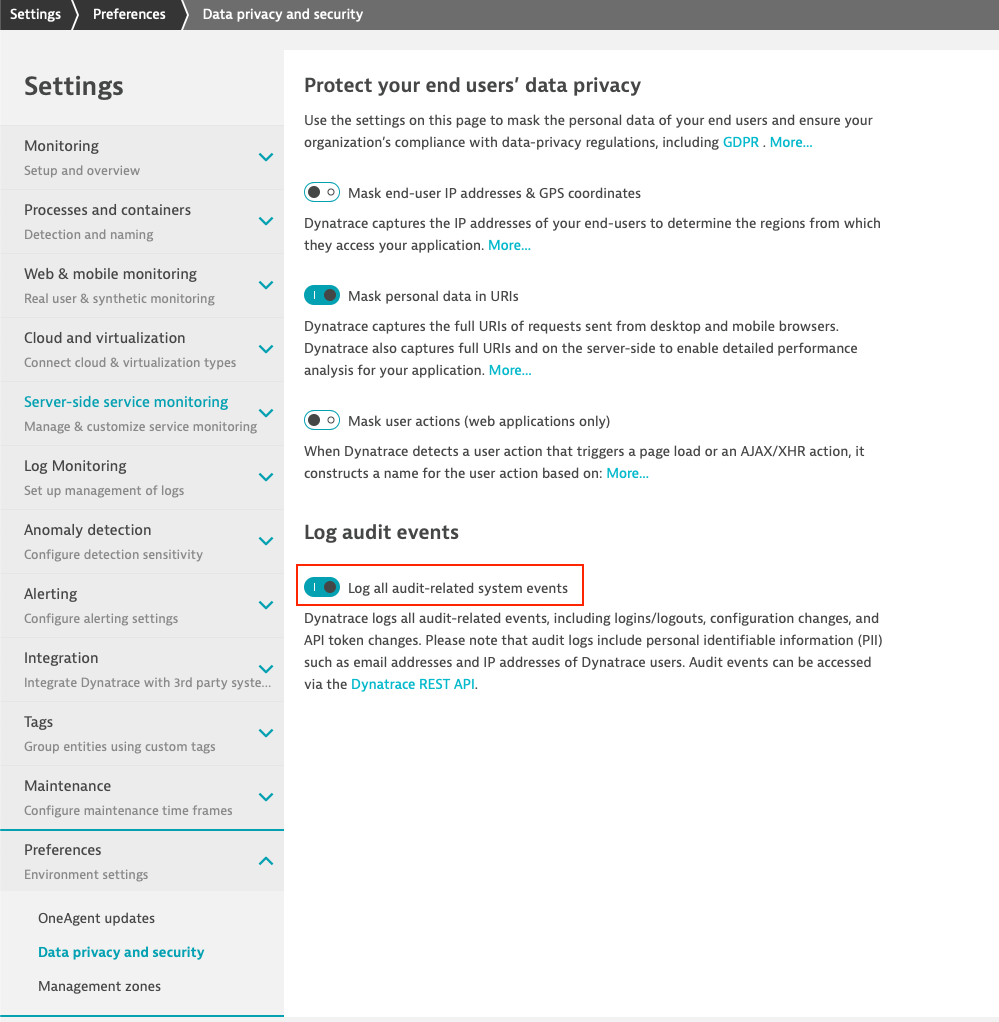
- Go to Settings > Preferences > Data privacy and security and enable Log all audit-related system events.

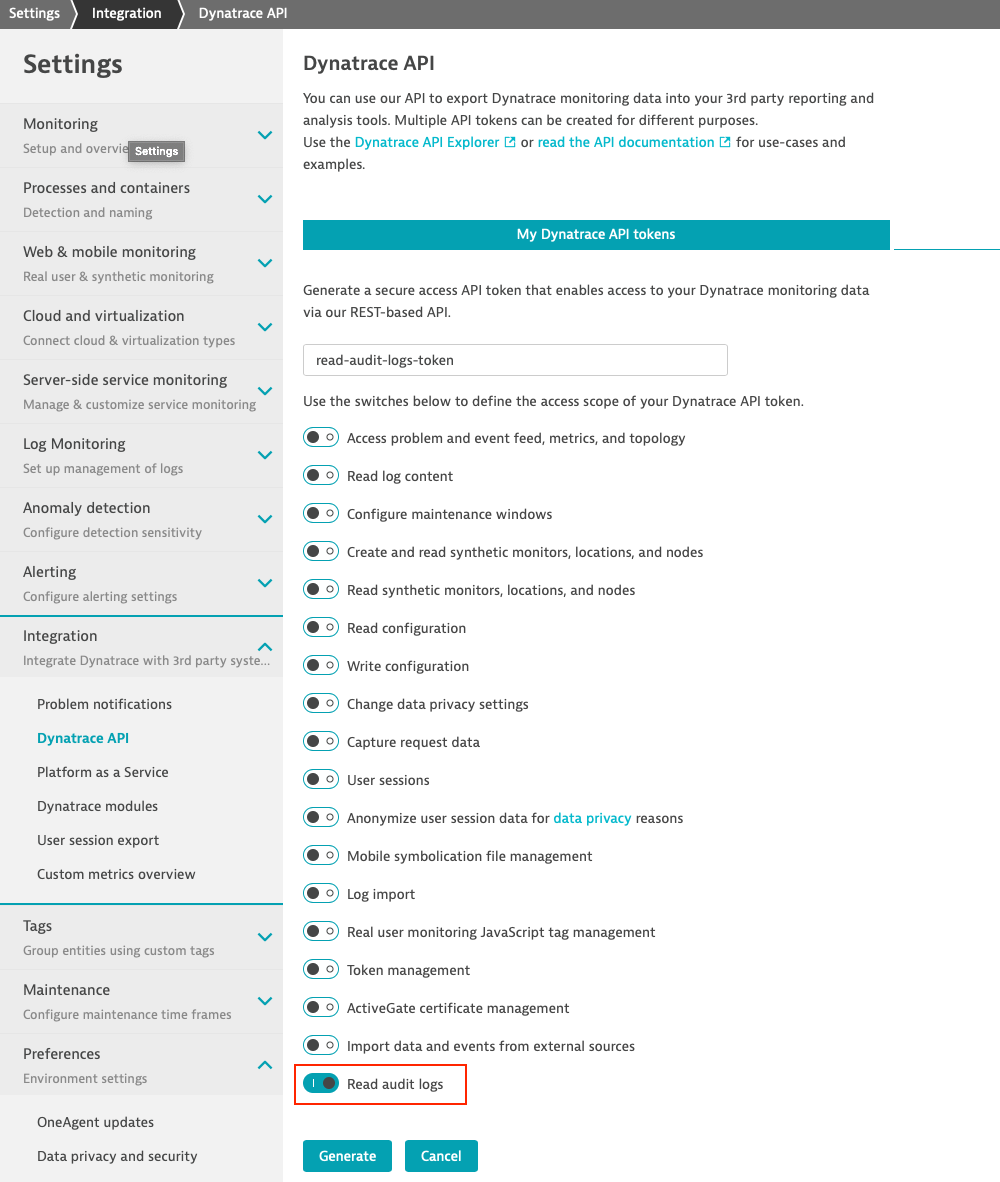
2. Go to Settings > Integration > Dynatrace API > Generate token. Give the token a name and enable Read audit logs. Alternatively, use an existing API token by adding this access scope.

3. Copy the Generated token value.
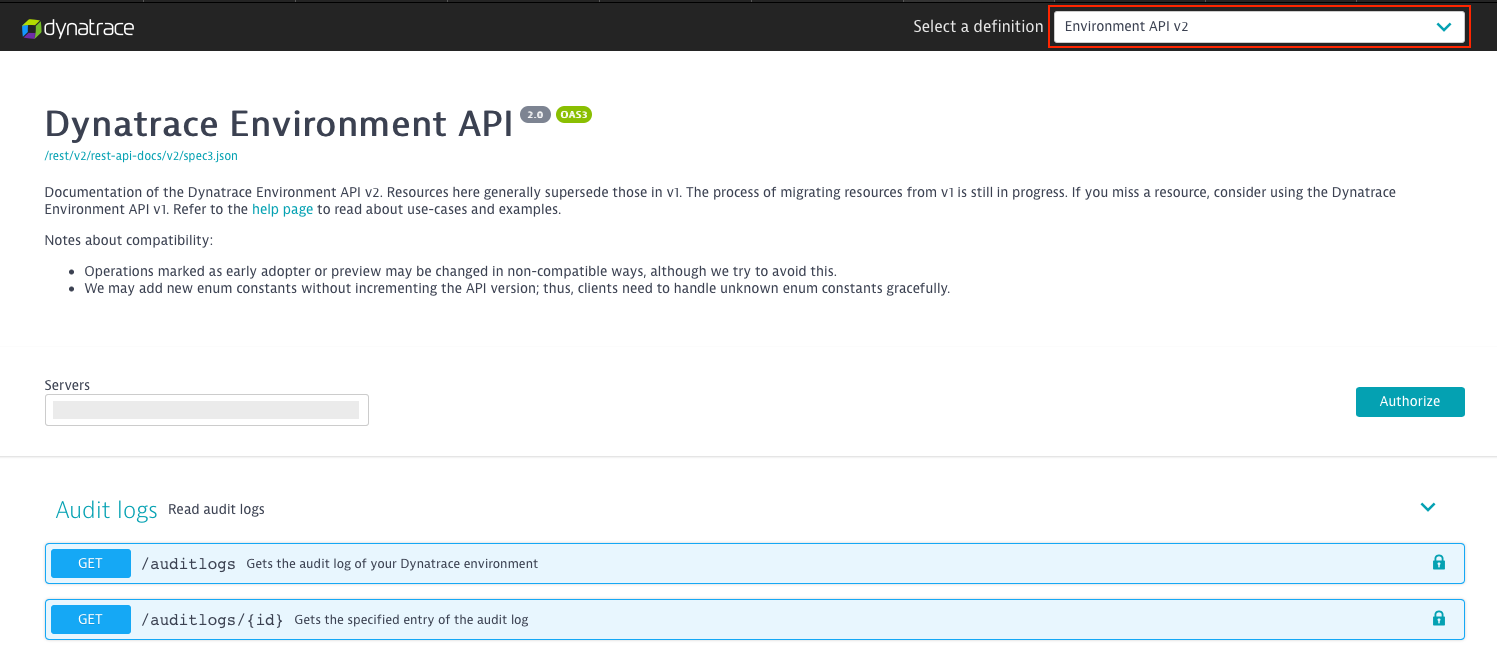
4. The /auditlogs API endpoint is available in the Dynatrace Environment API v2

5. Use the copied API token within the Authorization header to get the audit logs for a given timeframe.
Environment audit logs are stored once the audit feature is enabled, as explained in the first step of the setup above. Events that occur before the feature is enabled aren’t stored!
Audit logs are retained for 30 days and then automatically deleted.
Note: If you need to store audit logs for a longer period of time, for example, to meet compliance standards, we recommend that you set up an automated process that downloads audit logs every day and stores them in your own infrastructure.
A full article of this can be found on:
- Mark as New
- Subscribe to RSS Feed
- Permalink
17 Jan 2020 08:44 AM
Thank you so much @Chad T. for this tutorial, it is really appreciated!
- Mark as New
- Subscribe to RSS Feed
- Permalink
16 Jan 2020 10:37 PM
Hey Chad,
My customer has been asking for this featured for a while! Happy to see it was released.
Thanks for the mini tutorial.
Cheers
-Dallas
- Mark as New
- Subscribe to RSS Feed
- Permalink
17 Jan 2020
01:51 PM
- last edited on
06 Mar 2024
10:55 AM
by
![]() IzabelaRokita
IzabelaRokita
Well I spent some time yesterday on this in terms of attempting to get this into Splunk. I have been trying to take the approach to make it as easy and vendor supported as possible. I have not had much luck yet after trying a few things. In order to save people some time, here is what I have tried to date.
Splunkbase
I found 2 different apps that have been designed to work with Dynatrace.
Both work with one another and after reading the documentation on these, it did not appear that it would work for this, but I gave it a try anyway and had no luck. They seemed to be focused on time series metrics for the most part. Also, the last version was Oct. 30, 2018 so I am not expecting to see an update anytime soon for the added feature of the audit log.
GitHub
I also did some searching on GitHub. Within that search I was able to locate both of the above Splunk apps and thought perhaps I could get my hands on the master as I believe both were built using the Splunk Add-On Builder. I did find one repository with it, but when you attempt to import it into Add-On Builder (v2.2.0), it fails. There is a new version of Add-On Builder which is 3.0.1, but I have not been able to test that yet as we first need to do a Splunk upgrade.
Splunk Add-On Builder
After going through all the above with no success, I decided to try using the Splunk Add-On Builder to just create my own. Off to a good start, but far from it working.
Next steps
I spent just about the entire day trying different things around this. In doing so, I found that it comes down to 4 options that I can think of at this time.
Option 1: License the 3rd party Splunkbase app "REST API Modular Input" app
I won't go into details here, but I found many people currently using this app for exactly this type of need. This Splunk app provides a straight forward, time savings method for polling data from RESTful endpoints. While you could do this yourself with something like the Splunk Add-On Builder which of course is free, it's also a lot of work. The developer of this app has done the hard work for you, at least from what I can tell so far. I plan to test this out to see just how good it is and will provide an update later. You can find the app on Splunkbase here.
Option 2: Start from scratch with Splunk Add-On Builder
As much as I do love to learn new things and really get into the gears of how things work, I also don't have the time right now. I have started to build an app using this method. Setting up the connection and all the initial steps are straight forward and I was able to pull the JSON of the audit long. Thats where things get difficult and you will end up spending most of your time if you go with this option. As before, I am not going to go into details here around the configuration of Splunk, but between all the mapping and other configurations that would need to be done, it makes option 1 above look much more inviting for myself anyway.
You can find the Splunk Add-On Builder here.
Note: Pay attention to the version you download. There are currently 2 version. If your instance of Splunk is below version 8.0, the Splunk Add-On Builder v3.0.1 will not work correctly. Unfortunately Splunk allows you to install apps that may not be compatible, meaning there is no check in their install engine. This is a pet peeve of mine with Splunk, but thats another story.
Option 3: Setup the Splunk HTTP Event Collector
The HTTP Event Collector is an endpoint that lets you send application events directly to the Splunk platform via HTTP or HTTPS using a token-based authentication model. You can use any standard HTTP Client that lets you send data in JavaScript Object Notation (JSON) format.
My thought here is to create a script that can be execute by either cron or some other scheduler which would pull the audit log from Dynatrace on a time interval of my choosing and would then send that log to Splunk via the HTTP Event Collector.
You can find the documentation on the Splunk HTTP Event Collector here.
Option 4: Custom script to pull down the audit log and use a Splunk Forwarder
Same thing as option 3 for the most part with the only difference being that your custom script would write the Dynatrace audit data to a local log where a configured Splunk Forwarder would pick it up and index it in Splunk like any other log. You would most likely want to ensure you have setup this custom script for rolling logs which the Splunk Forwarder knows how to work with.
Final thoughts...
Out of all these options, I think option 1 is the one I am going to try to work with first. While I have not tested this yet, it does appear that it would make everything straight forward and much easier to setup and have working. It's also a licensed app with support and not expensive. Plus, I could think of many other things I could use that app for beyond just Dynatrace providing even more value. Again, I have not tested this yet so it is only theory right now.
Recommendation to Dynatrace
Like with all vendors there are pros and cons. Splunk is a great tool, but when it comes to polling for data, this has never been an area they shine in. I would love to see Dynatrace add the ability to stream this data. That option currently exists today for user sessions and I think providing the same option around the audit log would be a huge value. You could easily then as a customer stay in a 100% vendor support solution because you could configure the Splunk HTTP Collector with a listener and then point the Dynatrace Audit Log Stream right to that Splunk HTTP Collector. In fact, it could really be considered an out of the box integration.
I will update when I do more testing. Hope this all helps!
- Mark as New
- Subscribe to RSS Feed
- Permalink
17 Jan 2020 02:09 PM
Very good write up! thanks for following up on this and providing your experiences so far. I guess it is safe to say that the splunk apps are not working as expected when it comes to ingesting Data into Dynatrace.
- Mark as New
- Subscribe to RSS Feed
- Permalink
17 Jan 2020 02:16 PM
You're welcome! To be clear, the Splunk apps for Dynatrace do work for what they were intended for at the time. Audit logs where not available at the time the apps were last updated. The problem there is that from what I can tell since I was able to find the repository in GitHub is that the apps have been somewhat abandon. They were built using the Splunk Add-On Builder, but when I attempted to import the master into our instance, it failed. There is a 50/50 chance that they might end up getting updated to include the ingestion of the audit log, but I am not holding my breath considering the last update to them was in 2018.
I really think the perfect solution here would be if Dynatrace adds the ability to stream this log like they did with user sessions. That in my opinion would be ideal. Since this is still in early adopter status, perhaps they will take that into consideration.
- Mark as New
- Subscribe to RSS Feed
- Permalink
17 Jan 2020 02:22 PM
Oh okay. So are you guys also currently using the splunk app to ingest the dynatrace data? Are you going to perform? It would be great if we could meet up and discuss this.
- Mark as New
- Subscribe to RSS Feed
- Permalink
17 Jan 2020 02:30 PM
No as we have really found no need until now with the audit logs to use Splunk with Dynatrace. I am not opposed to it, I just have not seen any real reason to do it until now.
I guess if you are a company that has gone all out with Splunk, then I can see where bringing in the metrics from Dynatrace would be of high value, but for us that is not the case. It's actually the other way around 🙂
We want Dynatrace being the one thing that is everywhere. It all really just depends on what your company uses Splunk for in the end. I know our instance is mainly for a single point to view all logs and the ability to conduct advanced searches on those. Plus being able to retain the data based on our needs.
Yes, I am going to PERFORM 2020 and can't wait! I went last year as well. I think that would be great to meet up and talk about this. I know there were a few other community members on here that said the same thing. Let's plan on it.
- Mark as New
- Subscribe to RSS Feed
- Permalink
17 Jan 2020 02:41 PM
Okay, Yeah we are looking to send Dynatrace Data to splunk so we can have 2 platforms that share data back and forth. I have added you on linked in!
- Mark as New
- Subscribe to RSS Feed
- Permalink
17 Jan 2020 02:55 PM
Thank you! I will get over there and accept it in just a few. In your case, I would for sure then check the Dynatrace App For Splunk on Splunkbase.
There are 2 apps in total that are dependent on each other.
Both are free and the install is very straight forward and easy. From what I seen of it while looking into the audit stuff, I think it would give you what you are looking for most likely. I don't think it offers bidirectional functionality though. Only pulls from Dynatrace. Worth a try anyway. Keep in mind though, the last update to it was in 2018. Everything I looked at around it that I was able to find made it look like it had been abandon.
- Mark as New
- Subscribe to RSS Feed
- Permalink
17 Jan 2020 03:01 PM
Also, look into the "REST API Modular Input" app on Splunkbase. You can find it here. This is a 3rd party app which you license. It has been around for sometime, gets updated frequently, and because it's a paid for app, it has support. This is the next thing I am trying for the audit logs, but it would most likely also give you the other functionality you are looking for perhaps.
- Mark as New
- Subscribe to RSS Feed
- Permalink
28 Jan 2020 02:36 PM
Good news all - I have Dynatrace SaaS audit logs going to Splunk as of this morning.
I have been experimenting with what I thought was the best solution and found this is it and is very simple to do. I am currently writing a tutorial on it and will post it later today. All it takes is an add-on app for Splunk from a 3rd party developer which in return gives Splunk the ability to conduct pulls instead of just listening like it does with the Event Collector and then a custom class I did that you add to a Python file in order be the acting ResponseHandler and you are off and running.
Look for the tutorial later today 🙂

- Mark as New
- Subscribe to RSS Feed
- Permalink
28 Jan 2020 09:28 PM
Awesome!! Thanks for this!
- Mark as New
- Subscribe to RSS Feed
- Permalink
28 Jan 2020 10:00 PM
You're welcome! Ended up a bit busy today, so I will get the tutorial posted in the morning.
- Mark as New
- Subscribe to RSS Feed
- Permalink
14 Feb 2020 05:38 AM
I know, I am late 🙂 I should be able to get the tutorial posted by end of day Friday.
- Mark as New
- Subscribe to RSS Feed
- Permalink
27 Feb 2020 05:16 PM
Just an FYI or this thread... The tutorial has now been posted and can be found here.
- Mark as New
- Subscribe to RSS Feed
- Permalink
22 Apr 2025 07:46 PM
Sorry to revive this thread - but is there a non-Splunk way to do this natively in Dynatrace + Grail + DQL?
- Mark as New
- Subscribe to RSS Feed
- Permalink
22 Apr 2025 10:26 PM - edited 22 Apr 2025 10:27 PM
Would you believe me if I told you that over the weekend, while I was watching anime with my son, I started programming something to analyze the audit logs? And just now, as I was about to share it on the forum, I randomly came across your question.
Dashboard: auditlogs
Sections
- EventType
- Category
- Users
- Logins
- EntityID
with Count and Timeseries per Event and a nice filters in the top to read the logs everything controlled by the Timeframe selected
Hope it helps.
- Mark as New
- Subscribe to RSS Feed
- Permalink
23 Apr 2025 01:54 PM
Thanks for setting this up!!! I converted to English for whoever wants this.
Featured Posts

