- Dynatrace Community
- Ask
- Extensions
- Connection reset by peer (IBM DataPower Extension)
- Subscribe to RSS Feed
- Mark Topic as New
- Mark Topic as Read
- Pin this Topic for Current User
- Printer Friendly Page
- Mark as New
- Subscribe to RSS Feed
- Permalink
08 Apr 2021
07:50 AM
- last edited on
05 Jun 2025
10:04 AM
by
![]() MaciejNeumann
MaciejNeumann
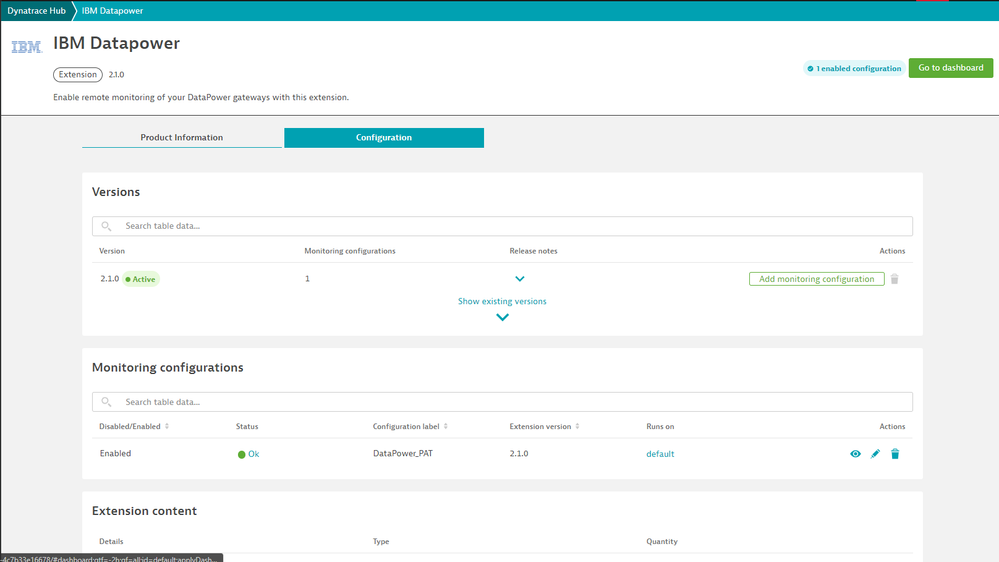
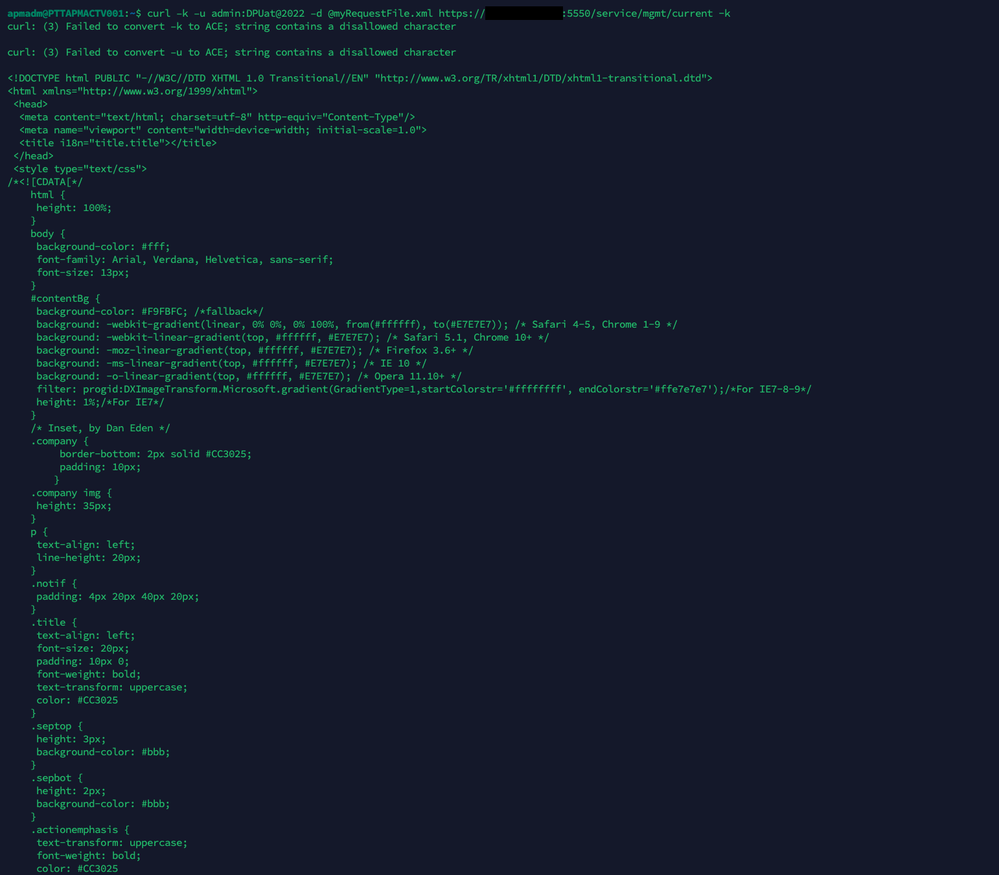
We've installed this plugin in our managed system. We can "telnet" port 5500 from ActiveGate VM of this appliance with no problems, but we're seeing this error in log files and also when we try to curl the XML Management Interface.
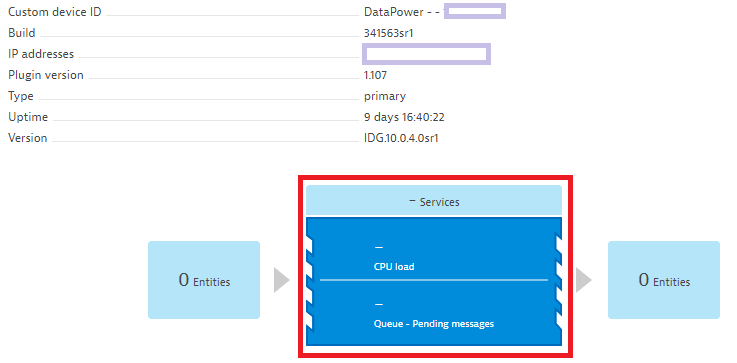
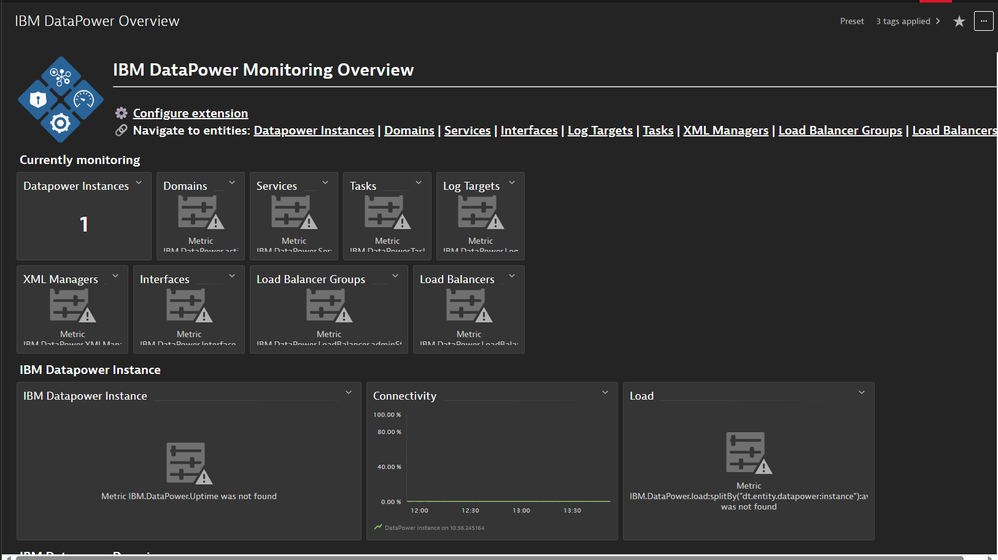
We have only one metric showing up in the UI, which is, "Connectivity". It shows 0.
Do you guys have any suggestions?
Solved! Go to Solution.
- Labels:
-
activegate
-
dynatrace managed
-
extensions
-
IBM
- Mark as New
- Subscribe to RSS Feed
- Permalink
08 Apr 2021 09:52 AM
Hi,
I remember faintly that we had a similar issue, which was related to the access rights given to the user which we had defined in the DataPower endpoint config. Unfortunately I don't have any documentation about it, but it was fixed by the DataPower specialist who saw in the local DP logs that the user wasn't authorized to do what it was trying to do. It was directly fixed by him, so I indeed don't have the details about what rights exactly were required. But if that helps in any way, I'd recommend investigating this on the DataPower end.
- Mark as New
- Subscribe to RSS Feed
- Permalink
14 Aug 2022 08:50 AM
Hello @kalle_lahtinen & @serhat_balik
What is the default port? I used 5550/5500/443 with and without credentials, but no metrics/services data is retrieving. What could be the issue?
Regards,
Babar
- Mark as New
- Subscribe to RSS Feed
- Permalink
14 Aug 2022 10:55 AM
5550 is the default one (the default URL is in the display hint when setting up the extension)
- Mark as New
- Subscribe to RSS Feed
- Permalink
14 Aug 2022 11:46 AM
Hello @Mike_L
Thank you. Is the given URL hint, or should it be the same URL? The DataPower person is unable to provide the correct information.
Regards,
Babar
- Mark as New
- Subscribe to RSS Feed
- Permalink
14 Aug 2022 11:48 AM
There have been some customers with a different URL, but in 90-95% of the cases it has been the one in the displayhint.
- Mark as New
- Subscribe to RSS Feed
- Permalink
14 Aug 2022 11:52 AM
Hello @Mike_L
I will go through with them and come back to you for further assistance if required.
Regards,
Babar
- Mark as New
- Subscribe to RSS Feed
- Permalink
18 Aug 2022 11:52 AM
Hello @Mike_L
Once port 5550 (https://00.00.00.00:5550/service/mgmt/current) opened then we tried a user having the read access on the default and read/write access on all projects but we are not getting any sort of metric data plus the services. We used LDAP user.
What could be the issue?
What types of permissions are required?
Regards,
Babar
- Mark as New
- Subscribe to RSS Feed
- Permalink
18 Aug 2022 02:08 PM
Hi @Babar_Qayyum,
Based on the properties, it appears some of the calls are working correctly. Can you please check the extension logs to see what may be going on?
C:\ProgramData\dynatrace\remotepluginmodule\log\remoteplugin\custom.remote.python.datapowerxml
or
/var/lib/dynatrace/remotepluginmodule/log/remoteplugin/custom.remote.python.datapowerxml
Thanks,
David
- Mark as New
- Subscribe to RSS Feed
- Permalink
21 Aug 2022 02:29 PM
Hello @DavidMass
I did not find anyother thing except the following:
2022-08-21 13:12:02.156 UTC WARNING [Python][17093318922597055693][IBM DataPower][139800935380736][Thread-852] - [write] /dyna/dm_config/remotepluginmodule/agent/runtime/engine_unzipped/site-packages/urllib3/connectionpool.py:1013: InsecureRequestWarning: Unverified HTTPS request is being made to host '00.00.00.00'. Adding certificate verification is strongly advised. See: https://urllib3.readthedocs.io/en/1.26.x/advanced-usage.html#ssl-warnings
warnings.warn(
Regards,
Babar
- Mark as New
- Subscribe to RSS Feed
- Permalink
05 Dec 2023 06:35 AM
Now I have same issue. We using this URL: https://00.00.00.00:5550/service/mgmt/current for XML management Interface URL
- Mark as New
- Subscribe to RSS Feed
- Permalink
05 Dec 2023 09:02 AM
You can try to curl that address from the ActiveGate to make sure that it isn't a network issue. If that works then open a support ticket.
- Mark as New
- Subscribe to RSS Feed
- Permalink
05 Dec 2023 09:29 AM
I tried to curl with -k option and result is successfully. If I try to curl without -k option then result is Failed with certificate. 😞
- Mark as New
- Subscribe to RSS Feed
- Permalink
05 Dec 2023 09:58 AM - edited 05 Dec 2023 09:59 AM
When configuring the extension you can select whether or not to require a valid certificate. It's up to every unique organization though to decide if they are fine with that.
You can also pass in a certificate chain to the extension through the configuration.
- Mark as New
- Subscribe to RSS Feed
- Permalink
06 Dec 2023 06:33 AM
Yes, But now I have error is below:
[ddc84298-211b-3c28-9590-6b657af1786e][7120909108104966235][7123][err]2023-12-05 11:04:31,471 [ERROR] dynatrace_extension.extension (ThreadPoolExecutor-0_0): Failed polling URL: https://IPAdress:5550/service/mgmt/current with domain: default. Status code: 500. Request: <?xml version="1.0" encoding="UTF-8"?><env:Envelope xmlns:env="http://schemas.xmlsoap.org/soap/envelope/"><env:Body><dp:request domain="default" xmlns:dp="http://www.datapower.com/schemas/management"><dp:get-status class="DomainStatus"/></dp:request><dp:request domain="default" xmlns:dp="http://www.datapower.com/schemas/management"><dp:get-status class="IPAddressStatus"/></dp:request></env:Body></env:Envelope>. Reply: <?xml version="1.0" encoding="UTF-8"?>
- Mark as New
- Subscribe to RSS Feed
- Permalink
06 Dec 2023 07:49 AM
That 500 is coming from the DataPower device. Maybe check with the admin team there if they changed the path or something like that.
- Mark as New
- Subscribe to RSS Feed
- Permalink
06 Dec 2023 06:34 AM
Everything is OK. But no data for DataPower in Dynatrace WebUI
- Mark as New
- Subscribe to RSS Feed
- Permalink
06 Dec 2023 07:48 AM
The “OK” just means that the extension was found and ran. Not that it worked.
- Mark as New
- Subscribe to RSS Feed
- Permalink
06 Dec 2023 07:55 AM
Status is OK
But No metrics data
- Mark as New
- Subscribe to RSS Feed
- Permalink
06 Dec 2023 08:10 AM
The OK just means that the extension was found, not that it managed to connect. The log files on the ActiveGate has any connection errors.
- Mark as New
- Subscribe to RSS Feed
- Permalink
06 Dec 2023 08:10 AM
[ERROR] dynatrace_extension.extension (ThreadPoolExecutor-0_0): Failed polling URL: https://IPAdress:5550/service/mgmt/current with domain
- Mark as New
- Subscribe to RSS Feed
- Permalink
06 Dec 2023 08:13 AM - edited 06 Dec 2023 08:14 AM
You can test to curl from the ActiveGate to troubleshoot it further.
If I were you I’d go with a support case though.
- Mark as New
- Subscribe to RSS Feed
- Permalink
06 Dec 2023 08:19 AM
Yes, I try to curl many time.
Featured Posts


