This website uses Cookies. Click Accept to agree to our website's cookie use as described in our Privacy Policy. Click Preferences to customize your cookie settings.
Extensions
Turn on suggestions
Auto-suggest helps you quickly narrow down your search results by suggesting possible matches as you type.
- Community Home
- Platform
- Extensions
- Re: DataPower Plugin Metrics - Calls Per Second
Options
- Subscribe to RSS Feed
- Mark Topic as New
- Mark Topic as Read
- Pin this Topic for Current User
- Printer Friendly Page
Options
- Mark as New
- Subscribe to RSS Feed
- Permalink
22 Aug 2019
08:00 AM
- last edited on
05 Jun 2025
02:05 PM
by
![]() MaciejNeumann
MaciejNeumann
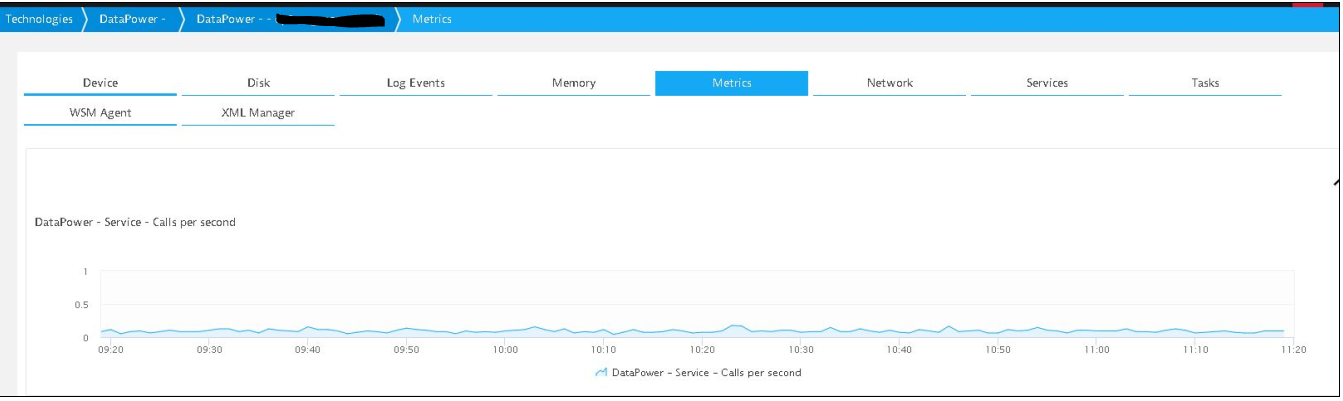
I'm monitoring services in DataPower, and built a dashboard that shows the statistics of the metric "Service - Calls Per Second" for each service. Some services show no data at all for the metric "Calls Per Second" although through looking at the "Service - Time" metric I can see that the service was working at that time frame.
Other then that, going into Further Details I can see that "Calls Per Second" appears under "Metrics" and not as a metric under "Services", so is it an overall metric for DataPower's functionality or can I use it per service?
So, how can I monitor how many calls the service had on the given time frame?
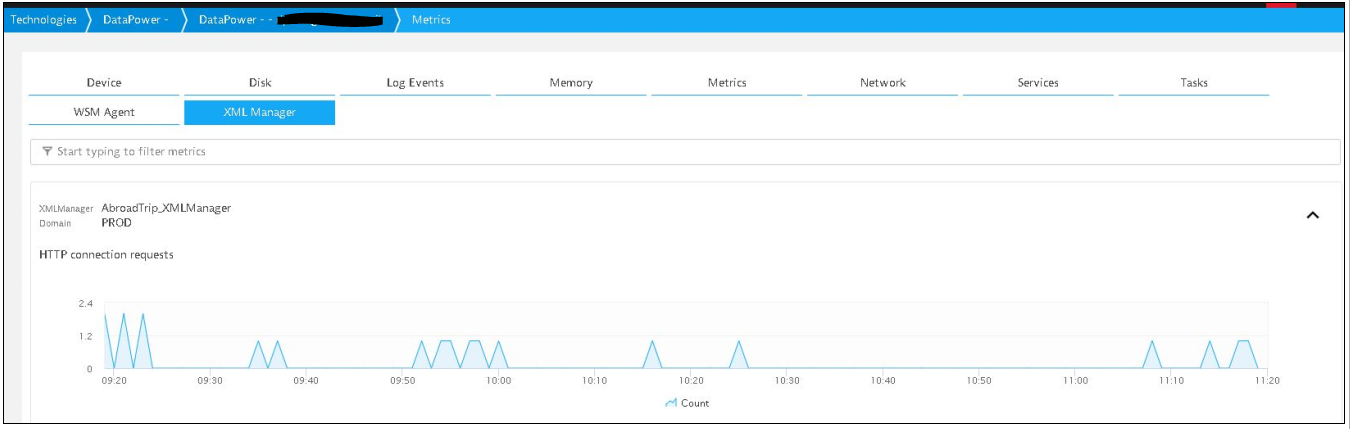
*** We have found a metric under XML Manager tab called: HTTP connection request. it is split per service.
can we use its data to count the number of uses of the service?
Solved! Go to Solution.
Labels:
- Labels:
-
extensions
-
IBM
12 REPLIES 12
Options
- Mark as New
- Subscribe to RSS Feed
- Permalink
22 Aug 2019 09:16 AM
When you are lookin at this page:
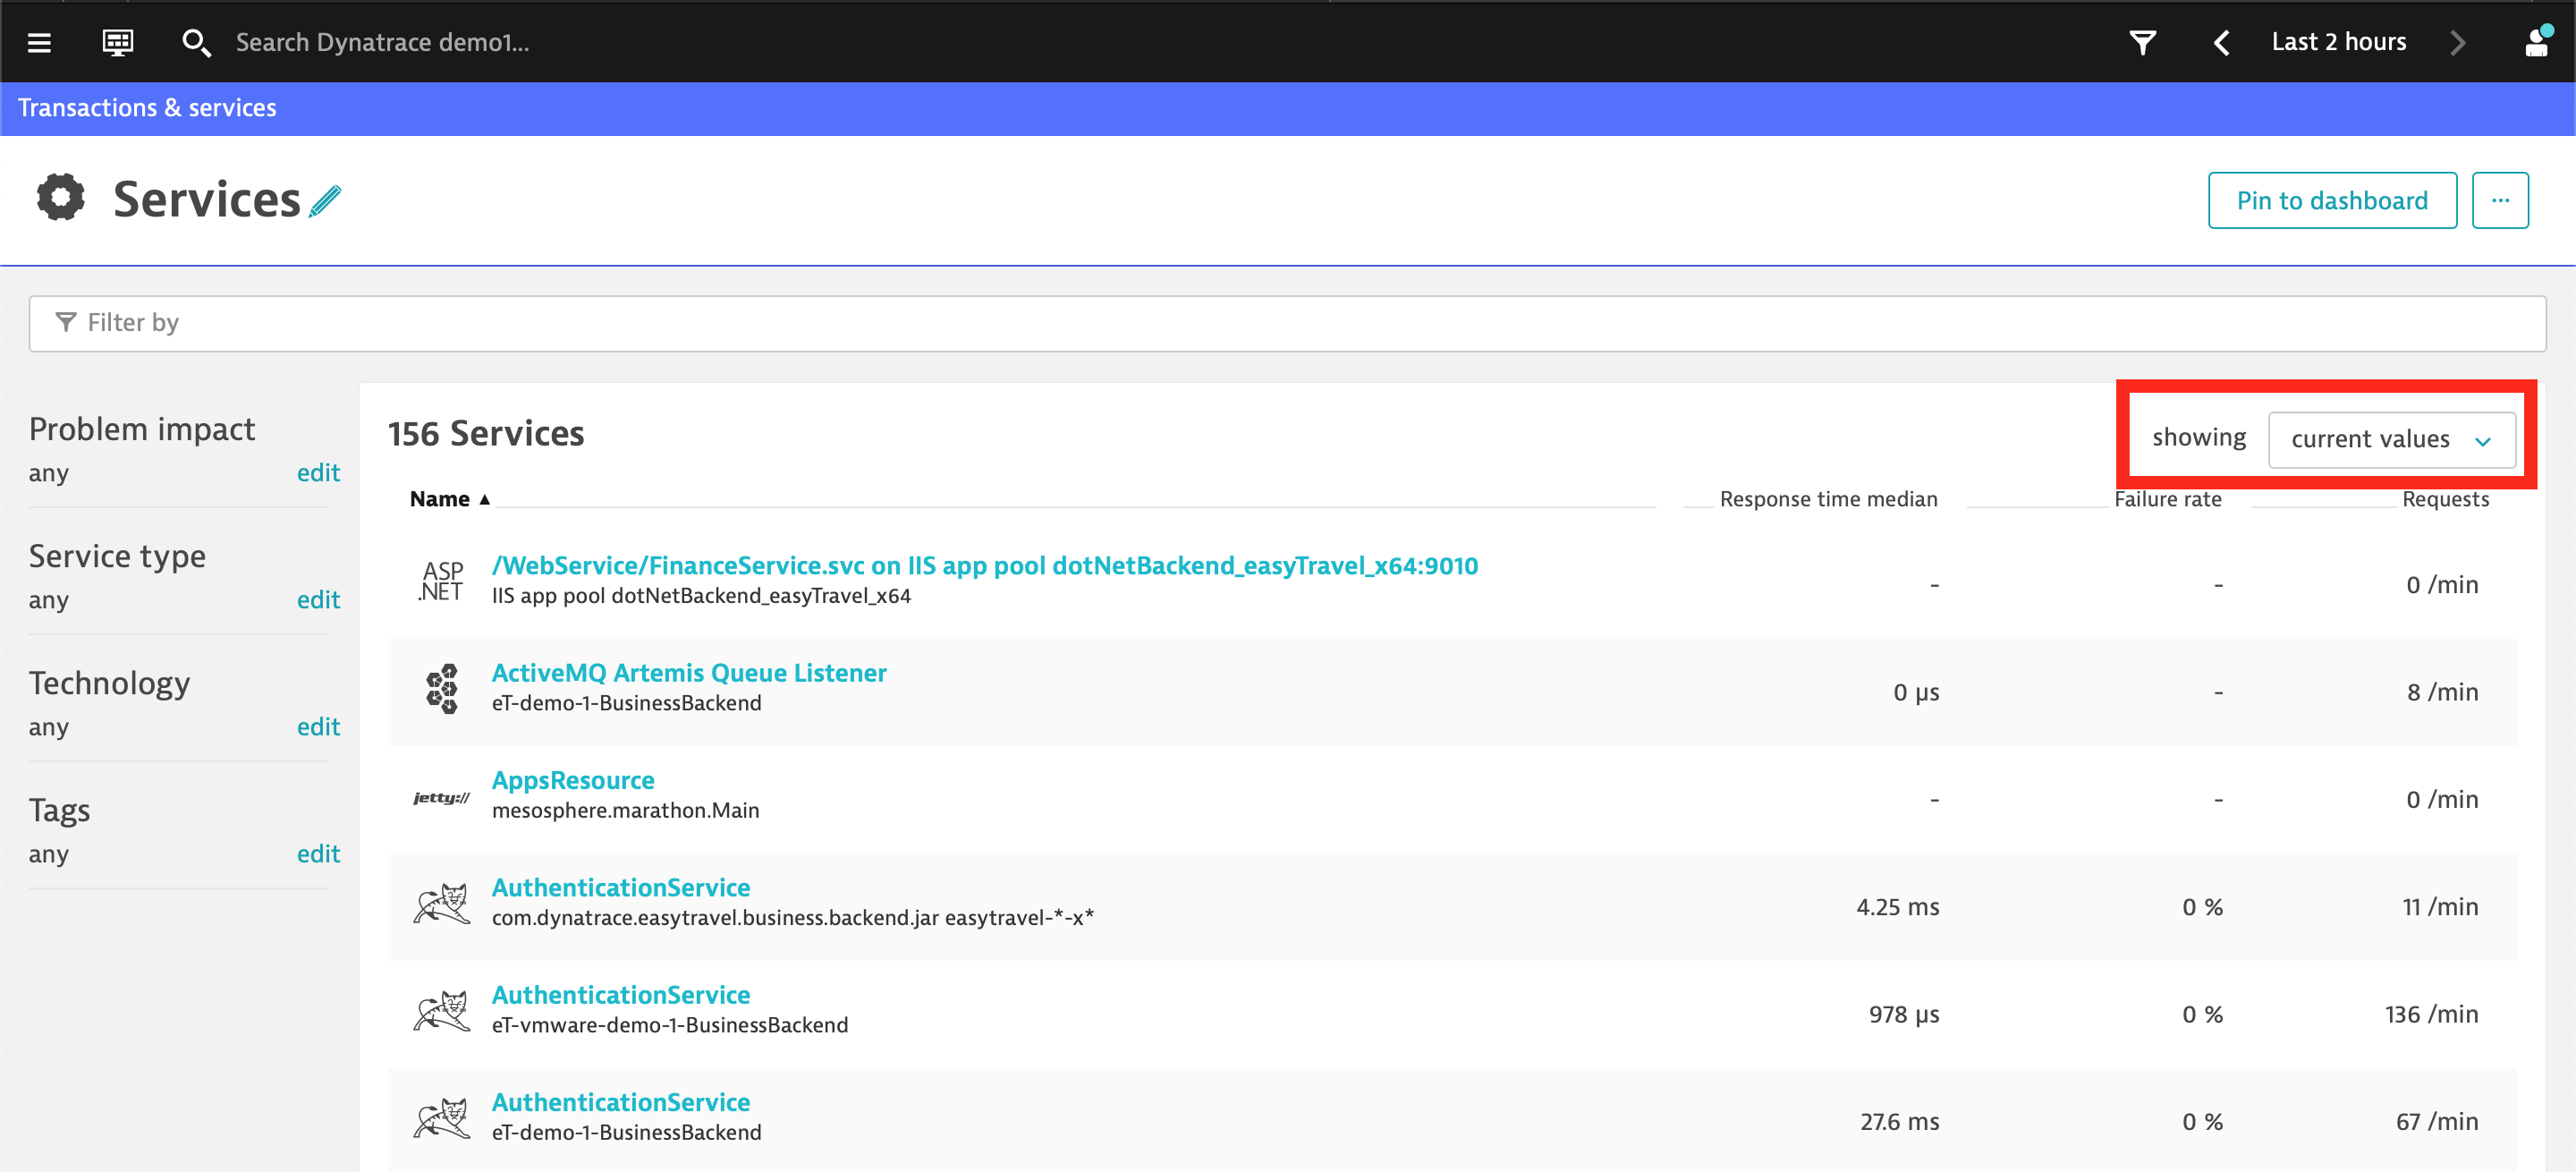
with global timefram set as last XX hours/min/days default option is showing current values. This is why you can see no requests on those services. You can change it to calculate over timeframe and you will see it. But amount of calls per minut for services that are used rarely may looks like around 0/min or so. If you want to know extact number of calls you can create multidimensional view inside service:
Sebastian
Regards, Sebastian
Options
- Mark as New
- Subscribe to RSS Feed
- Permalink
22 Aug 2019 09:29 AM
That is a good answer for question about services that oneagent discover & show 😉
Our question is about services that IBM DataPower plugin retrieve & show
dynatrace certificated professional - dynatrace master partner - Matrix Soft Ware Division - Israel
ibm-datapower-plugin-2.png
118 KB
ibm-datapower-plugin-1.png
118 KB
Options
- Mark as New
- Subscribe to RSS Feed
- Permalink
22 Aug 2019 09:31 AM
Ok my bad 🙂
Regards, Sebastian
Options
- Mark as New
- Subscribe to RSS Feed
- Permalink
22 Aug 2019 10:21 AM
Hi,
That metric should appear under services and not metrics. Could you open a support case for it?
Mike
Mike
Options
- Mark as New
- Subscribe to RSS Feed
- Permalink
22 Aug 2019 10:37 AM
Will do
Thanks
Yos
dynatrace certificated professional - dynatrace master partner - Matrix Soft Ware Division - Israel
Options
- Mark as New
- Subscribe to RSS Feed
- Permalink
22 Aug 2019 10:52 AM
Ask them for the 1.091 version, I just pushed that version out based on your screenshot and it should fix the metric location.
Mike
Options
- Mark as New
- Subscribe to RSS Feed
- Permalink
22 Aug 2019 02:49 PM
That did it, Thanks!
Options
- Mark as New
- Subscribe to RSS Feed
- Permalink
22 Aug 2019 04:18 PM
Hi Mike
Thanks a lot for the fast fix!
Just a quick question here as DP dummy, what is the HTTP connection requests metric stand for?

dynatrace certificated professional - dynatrace master partner - Matrix Soft Ware Division - Israel
Options
- Mark as New
- Subscribe to RSS Feed
- Permalink
28 Aug 2019 12:11 PM
An XML manager obtains and manages XML documents, stylesheets, and other document resources on behalf of one or more services.
The HTTP connection requests is the number of requests which uses HTTP connections.
Mike
Options
- Mark as New
- Subscribe to RSS Feed
- Permalink
29 Aug 2019 06:50 AM
Hi @Michael L. thanks a lot for explanation
dynatrace certificated professional - dynatrace master partner - Matrix Soft Ware Division - Israel
Options
- Mark as New
- Subscribe to RSS Feed
- Permalink
27 Jun 2020 12:20 AM
Hi,
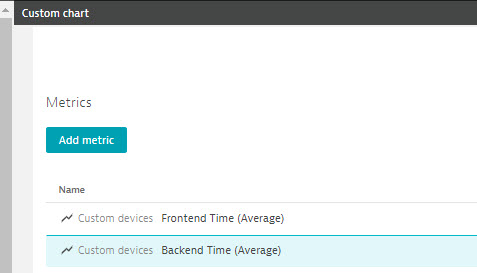
In the list of metrics available for datapower extension using custom chart, I can see two of them called "frontend time" and "backend time", which do not show data. Does anyone know if something needs to be configured in the datapower to deliver that information
Regards,
Juan
metrics.jpg
20 KB
Reply
Options
- Mark as New
- Subscribe to RSS Feed
- Permalink
27 Jun 2020 09:40 AM
Well spotted! Those two metrics can never get any data from the extension. They were added in the early days of the extension when a customer wanted to call the DataPower Rest API for all individual requests, calculate the time themselves and then push the results in using the API.
Mike
Featured Posts
