- Dynatrace Community
- Ask
- Extensions
- Displaying custom host metrics using plugin
- Subscribe to RSS Feed
- Mark Topic as New
- Mark Topic as Read
- Pin this Topic for Current User
- Printer Friendly Page
- Mark as New
- Subscribe to RSS Feed
- Permalink
07 Sep 2017 10:07 AM
I've created a custom oneagent plugin using the SDK sending host metrics. However I'm unable to display those metrics from custom plugin in the UI. Metrics are not displayed at the host level and also cannot be seen using when building custom chart or when defining custom alerts. However metric data sent by the plugin be successfully retrieved using timeseries REST APIs ( https://{id}.live.dynatrace.com/api/v1/timeseries ).
Also it does not matter if I specify the "ui" part in the plugin.json file or not. Am I doing something wrong or is dynatrace not able to display custom host metrics at the moment?
My plugin.json:
{
  "name": "custom.python.passwd_plugin",
  "version": "1.2",
  "type": "python",
  "entity": "HOST",
  "processTypeNames": ["LINUX_SYSTEM"],
  "source": {
    "package": "passwd_plugin",
    "className": "PasswdPlugin",
    "install_requires": [],
    "activation": "Singleton"
  },
  "metrics": [
    {
      "timeseries": {
        "key": "records",
        "unit": "Count"
      }
    },
    {
      "timeseries": {
        "key": "size",
        "unit": "Byte"
      }
    }
  ]
}
Solved! Go to Solution.
- Labels:
-
extensions
-
oneagent
- Mark as New
- Subscribe to RSS Feed
- Permalink
07 Sep 2017 10:45 AM
Displaying metrics on host are not yet officially supported. Debug flag must be turned on in order to display host metrics on the UI. Please contact with your Dynatrace sales rep.
- Mark as New
- Subscribe to RSS Feed
- Permalink
27 Mar 2019 09:35 AM
Could you tell me current status of this feature?
Is it needed to turn on the debug flag on latest version of OneAgent?
I'm trying to create an OneAgent plugin to display metrics on host.
- Mark as New
- Subscribe to RSS Feed
- Permalink
09 Jul 2019 08:36 PM
Hi, what is the latest status here? Do we still need to use the debug flag?
- Mark as New
- Subscribe to RSS Feed
- Permalink
10 Jul 2019 07:45 AM
As far as I've been told this should be available very soon. Definitely this year.
- Mark as New
- Subscribe to RSS Feed
- Permalink
04 Nov 2019 04:38 PM
Awesome, we are eagerly waiting for this.
- Mark as New
- Subscribe to RSS Feed
- Permalink
04 Nov 2019 09:15 PM
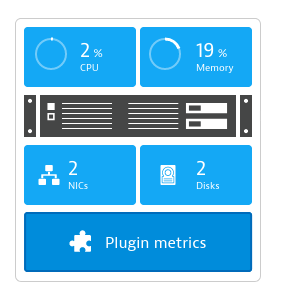
This already seems to be working (at least with Dynatrace 177+, Oneagent 175+). You get additional host tile:

For plugin example, see my simple host session count plugin available at:
https://github.com/juliusloman/dynatrace-oneagent-plugin-hostsessioncount
Featured Posts
