- Dynatrace Community
- Ask
- Extensions
- Re: Tomcat JDBC ext plugin and Dynatrace
- Subscribe to RSS Feed
- Mark Topic as New
- Mark Topic as Read
- Pin this Topic for Current User
- Printer Friendly Page
- Mark as New
- Subscribe to RSS Feed
- Permalink
20 Nov 2019
09:10 AM
- last edited on
05 Jun 2025
10:08 AM
by
![]() MaciejNeumann
MaciejNeumann
We are trying to get the JDBC-pool information out with the JDBC-plugin but seems that the plugin doesn't pick any information on Apache Tomcat (8.5.14.0) .
https://github.com/Dynatrace/JMX-Extensions/blob/master/Tomcat%20JDBC%20ext/plugin.json
Our application is using Mysql so therefore I doubt that I need to change the data sources but not sure where to start since we don't have access to jmx monitor currently and not sure if we could use the JMX editor to pick the correct measures?

Solved! Go to Solution.
- Labels:
-
extensions
-
java
-
jmx
-
mysql
- Mark as New
- Subscribe to RSS Feed
- Permalink
20 Nov 2019 01:17 PM
In general it is rather question for tomcat community or the one related to this plugin. We are in general asking admins for exposing some metrics on tomcats JMX'es and we are not making part in configuring it 🙂 But in general we are using this feature for JDBC and hikari application pools and we are measuring it via JMX.
Did you check this as well?
https://tomcat.apache.org/tomcat-7.0-doc/jdbc-pool.html#JMX
Sebastian
- Mark as New
- Subscribe to RSS Feed
- Permalink
21 Nov 2019 08:53 AM
Hi Sebastian,
Sorry about little frustration around this topic, but I would say that these configurations are way more complicated than it was on Appmon since can't use real wildcards to search trough all the possible JMX objects or attributes trough the JMX editor.
I would love to use the jconsole to check what these processes have eaten but seems that it's not going to happen on my on going cases and the tools which the Dyntrace itself offers are maybe not so useful or I just get the structure right how the editor shows the structure.
Can you comment about the JMX editor since I'm not sure if it's showing all the values that there is available on the agent/monitored process since haven't found anything related to jdbc connections from any tomcat instances I have available here?

-Janne
- Mark as New
- Subscribe to RSS Feed
- Permalink
13 Dec 2019 07:05 AM
Just for heads up for everyone who is struggling with the JDBC plugin and wondering why they are not seeing any metrics related to JDBC pooling.
In our case the JMX was not enabled on the JDBC pool and the JMX setting in collection pool was set to jmxEnabled="false" for some reason.
- Mark as New
- Subscribe to RSS Feed
- Permalink
22 Nov 2019 08:13 AM
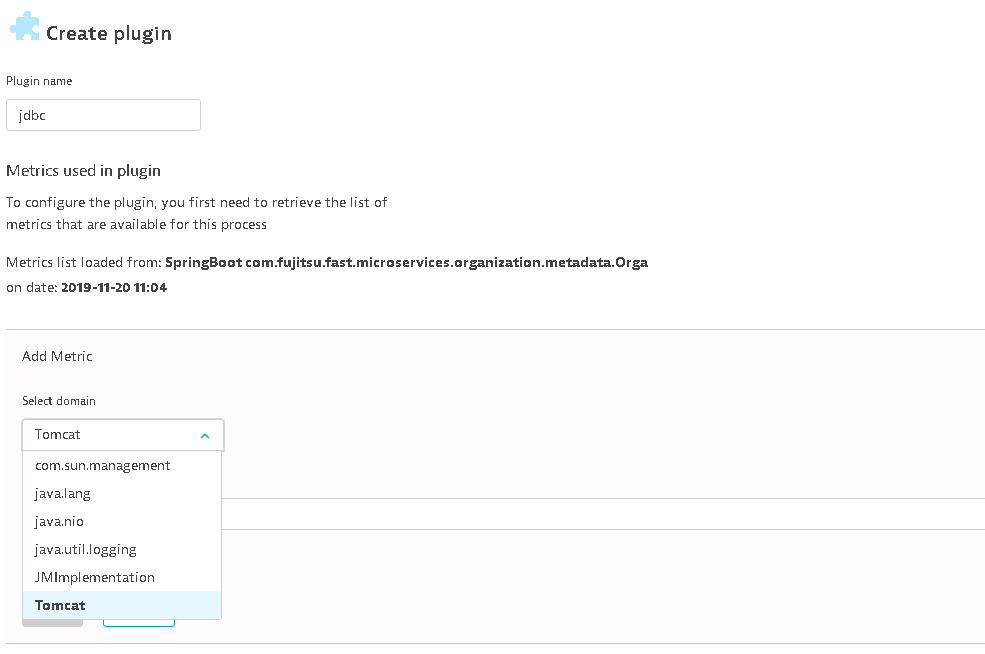
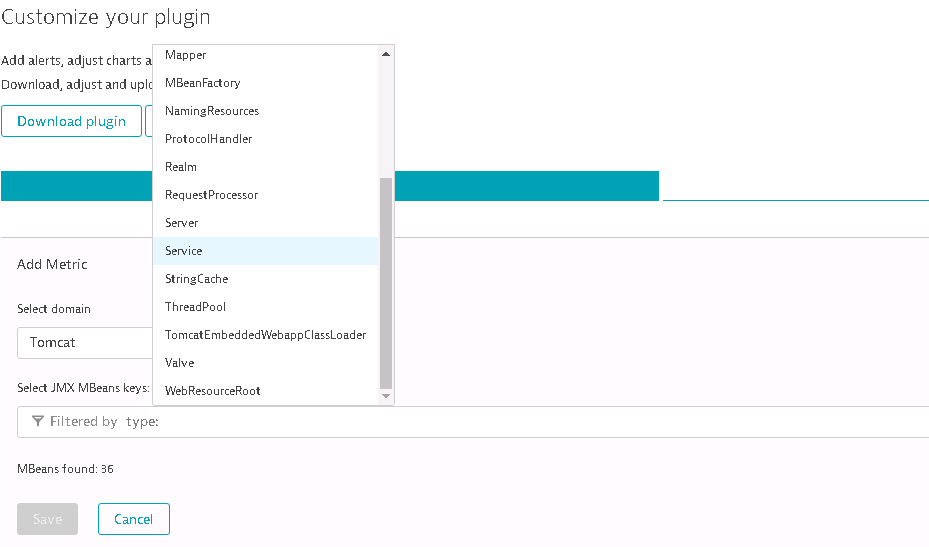
From my experience JMX editor presents all available metrics. Always when I was asking client about preparing some mbean for me, I was able to find it. The only difference is that than you have to find domain, but on those lists you have some generic options sometimes like
 When you pick this you will have option to find all available metrics filtered by name. This is how I'm using it.
Sebastian
- Mark as New
- Subscribe to RSS Feed
- Permalink
22 Nov 2019 08:35 AM
Hi Sebastian,
First of all, I want to say thank you for you help on this.
In matter of fact I also tried to find the corresponding metrics trough JMX editor without any luck yet. So with your experience could it be possible that the JDBC driver itself haven't been registered or configured as mbean source in our case?
This is little bit new topic for me so therefore just trying to figure out how move on with this one and where to find the information I need. Currently my main issue is that both of the environments currently don't have option for Jconsole use so it feels quite shot in the dark kind of situation to find the correct metrics.
-Janne
- Mark as New
- Subscribe to RSS Feed
- Permalink
23 Apr 2020 04:39 PM
Hi,
This is how I could do it:
1.- Use JMX/PMI extension editor. Specify a name,
2.- Click on "add metric source"
3.- Technology: Apache Tomcat
4.- Click on the pencil for the suggested source
5.- Specify a host and tomcat process that you know (verify first) has a service that uses a ddbb
6.- Click "Add metrics source"
7.- Click "Add Metric"
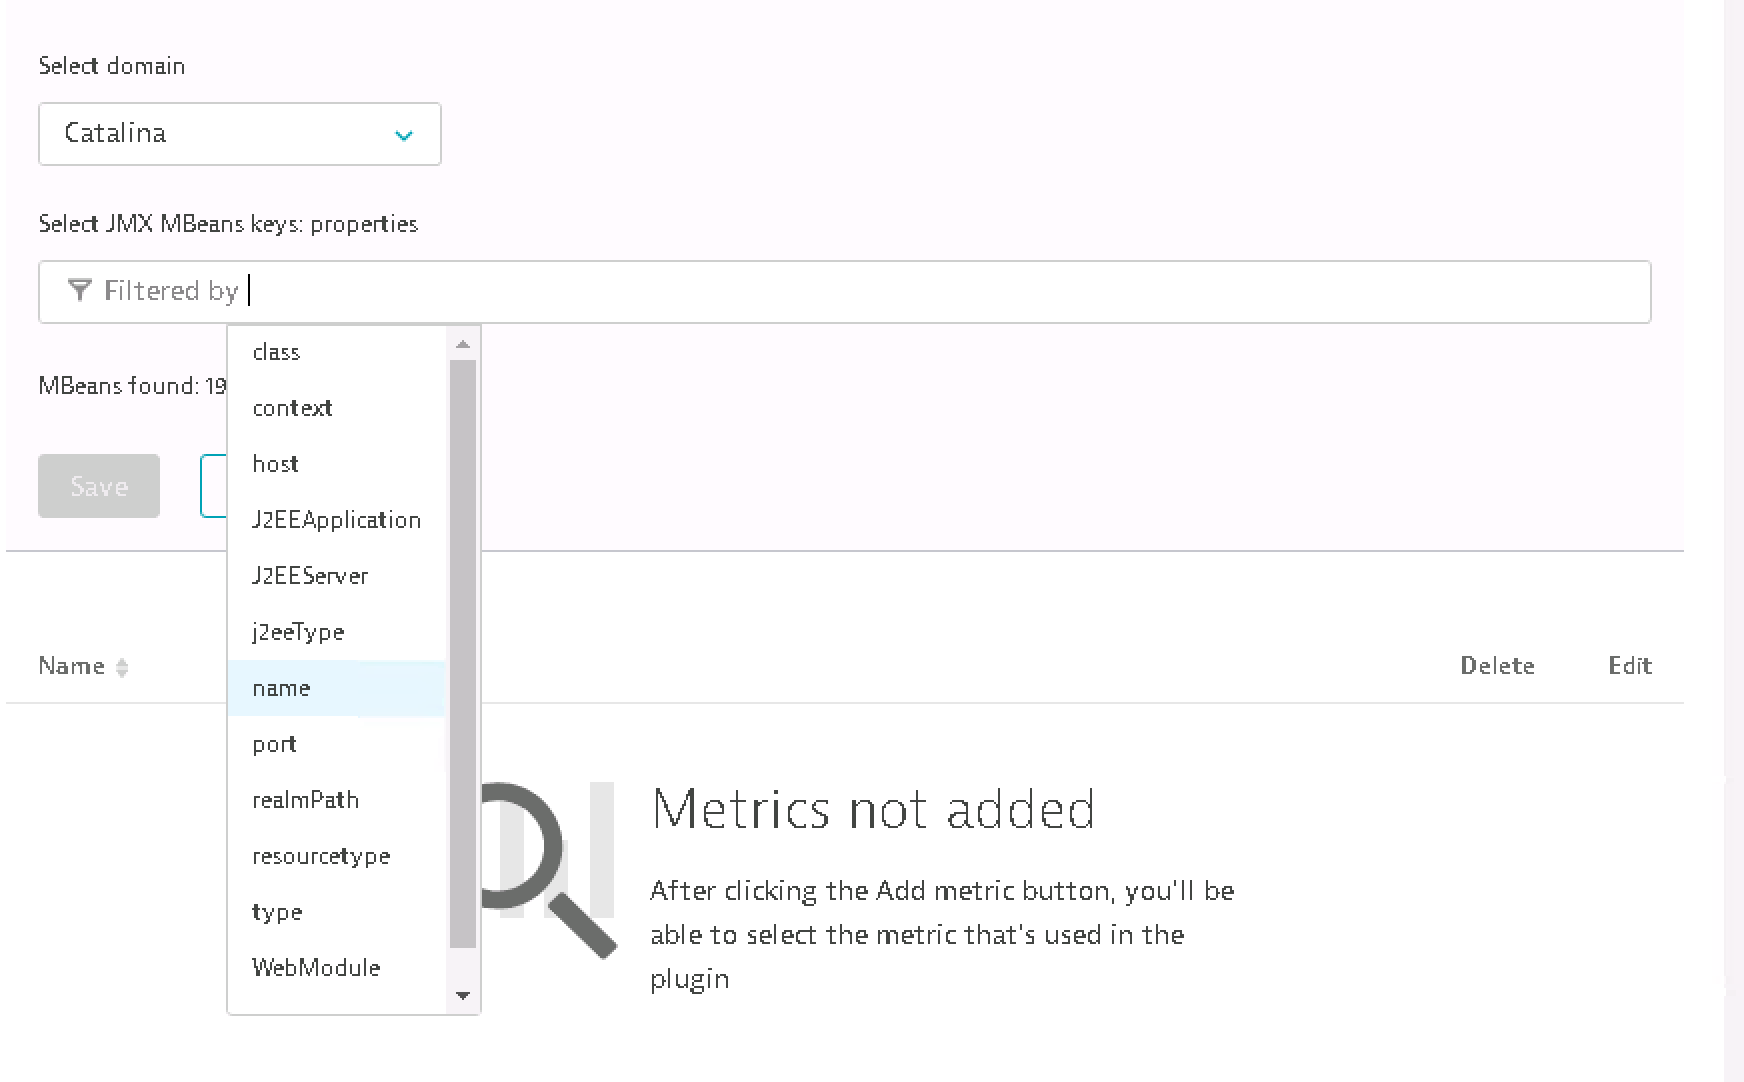
8.- For Domain select Catalina
9.- Now in the filter bar select "type"
10.- Select DataSource
11.- Now, go to the "Select atribute" list, and select maxActive or numactive.
Good luck anybody.
Antonio V.
- Mark as New
- Subscribe to RSS Feed
- Permalink
16 Nov 2020 04:49 PM
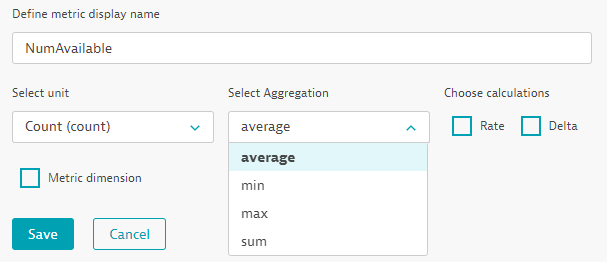
Hi Antonio how did you aggregate the metric in the configuration interface?
From my perspective I'm wondering why should I do the avg/min/max/sum of a Datasource that in a defined moment has a value X
Featured Posts
