This website uses Cookies. Click Accept to agree to our website's cookie use as described in our Privacy Policy. Click Preferences to customize your cookie settings.
Open Q&A
If there's no good subforum for your question - ask it here!
Turn on suggestions
Auto-suggest helps you quickly narrow down your search results by suggesting possible matches as you type.
- Dynatrace Community
- Ask
- Open Q&A
- Re: DT and PowerBI integration
Options
- Subscribe to RSS Feed
- Mark Topic as New
- Mark Topic as Read
- Pin this Topic for Current User
- Printer Friendly Page
Options
- Mark as New
- Subscribe to RSS Feed
- Permalink
23 Apr 2020 08:33 PM
Hi-
Has anyone integrated DT with PowerBI for environment api reports?
I want to use PowerBI for continuous reporting. Means Timeseries and Problem API chart should be feeding continuously to the PowerBI and we could easily customize the time frame for all metrics available.
Solved! Go to Solution.
Labels:
- Labels:
-
paas
-
reports
-
technologies
18 REPLIES 18
Options
- Mark as New
- Subscribe to RSS Feed
- Permalink
24 Apr 2020 08:12 AM
Hi @Roushan K.
Yes @Gil G. integrate them together
Yos
dynatrace certificated professional - dynatrace master partner - Matrix Soft Ware Division - Israel
Options
- Mark as New
- Subscribe to RSS Feed
- Permalink
24 Apr 2020 05:09 PM
can you please help me the way out.
Options
- Mark as New
- Subscribe to RSS Feed
- Permalink
25 Apr 2020 06:55 AM
Hi @Roushan K.,
It's a bit complicated to explain all in writing but I'll try to summarize the steps though.
Before hand, note there is a performance clinic I relied upon as far as I recall at https://www.youtube.com/watch?v=LpH8IlUeBSU
Now for the steps:
1. in your powerBI report define a web data source with the url for the API you need (for each query you need a different data source on the report).
In this data source you can also use parameters such as host name and token so that the report may be reusable for other tenants if you need it.
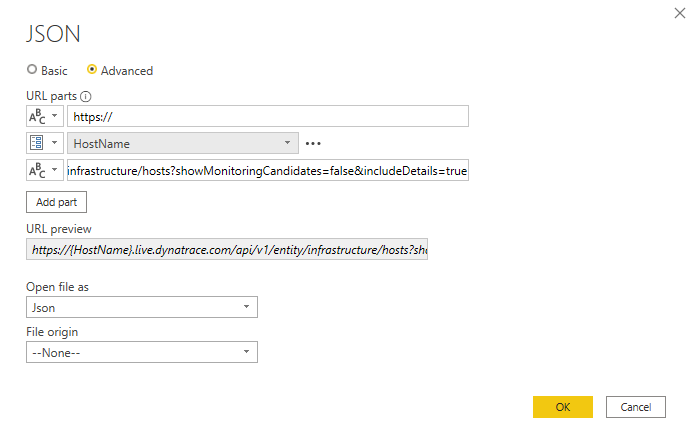
This example gets a list of the hosts in the environment.
DON'T FORGET to add the http headers required such as the "Authorization" for the token and the "Accept" to specify you expect json data.
2. Once the data source is defined, because it is in JSON format, you need to convert it to a tabular format. In the example above it's simple, but it could be that you'll need to traverse through the JSON result first until you get to the array part that includes the result. Once there, "Convert To Table"
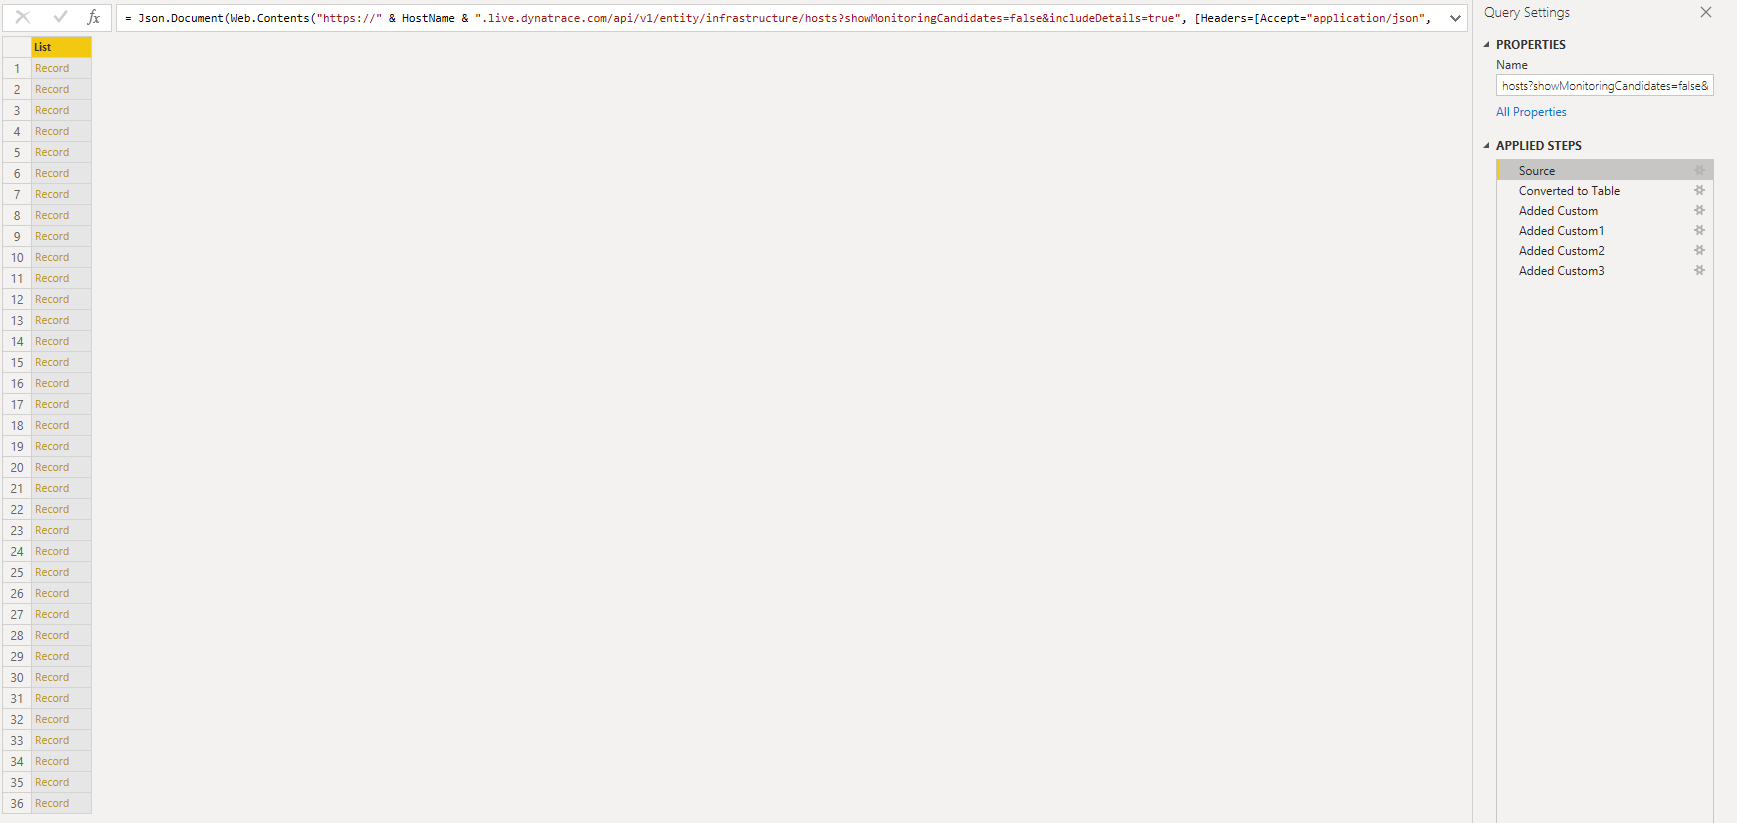
The above shows the results of the initial data source results. Use the "To Table" button to convert it to a table. Once pressed, you'll that the yellow header now shows Column1 instead of List.
3. After your data is in a "table format" you need to create the columns to refer to in your reports. Just use the Add Column and refer to the field name you need. Codewise in PowerBI it is (for example):
= Table.AddColumn(#"Converted to Table", "Host Name", each Record.Field([Column1],"displayName"))
Repeat these steps as necessary. If you go to advanced query editor you may end up with the following query code:
let
Source = Json.Document(Web.Contents("https://" & HostName & ".live.dynatrace.com/api/v1/entity/infrastructure/hosts?showMonitoringCandidates=false&includeDetails=true", [Headers=[Accept="application/json", Authorization="Api-Token XXXXXX-XXXXX-XXXXX"]])),
#"Converted to Table" = Table.FromList(Source, Splitter.SplitByNothing(), null, null, ExtraValues.Error),
#"Added Custom" = Table.AddColumn(#"Converted to Table", "Host Name", each Record.Field([Column1],"displayName")),
#"Added Custom1" = Table.AddColumn(#"Added Custom", "OsType", each Record.Field([Column1],"osType")),
#"Added Custom2" = Table.AddColumn(#"Added Custom1", "OsVersion", each Record.Field([Column1],"osVersion")),
#"Added Custom3" = Table.AddColumn(#"Added Custom2", "Host Group", each Record.Field(Record.Field([Column1],"hostGroup"),"name"))
in
#"Added Custom3"
4. Once you apply and save the query you are ready to build your report. Just choose your visualizations and drg the columns from the right part to the visualizations.
For example:
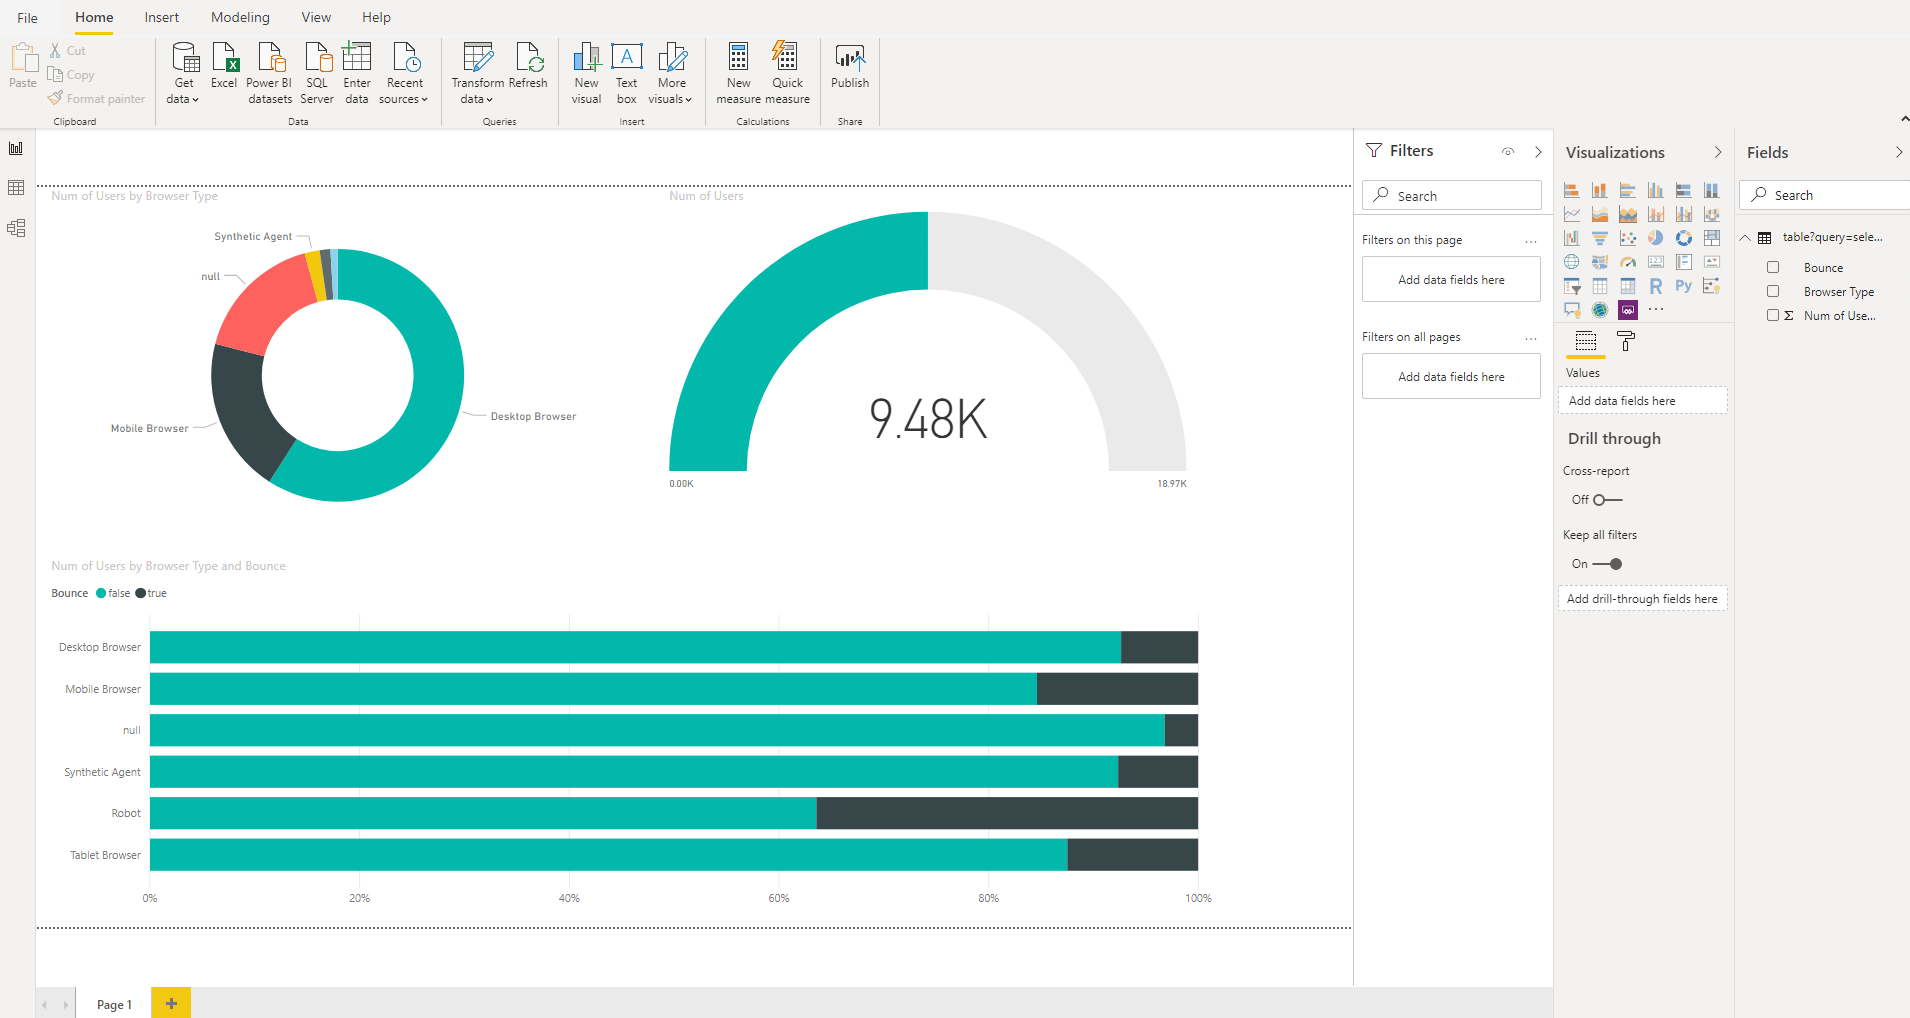 or
or
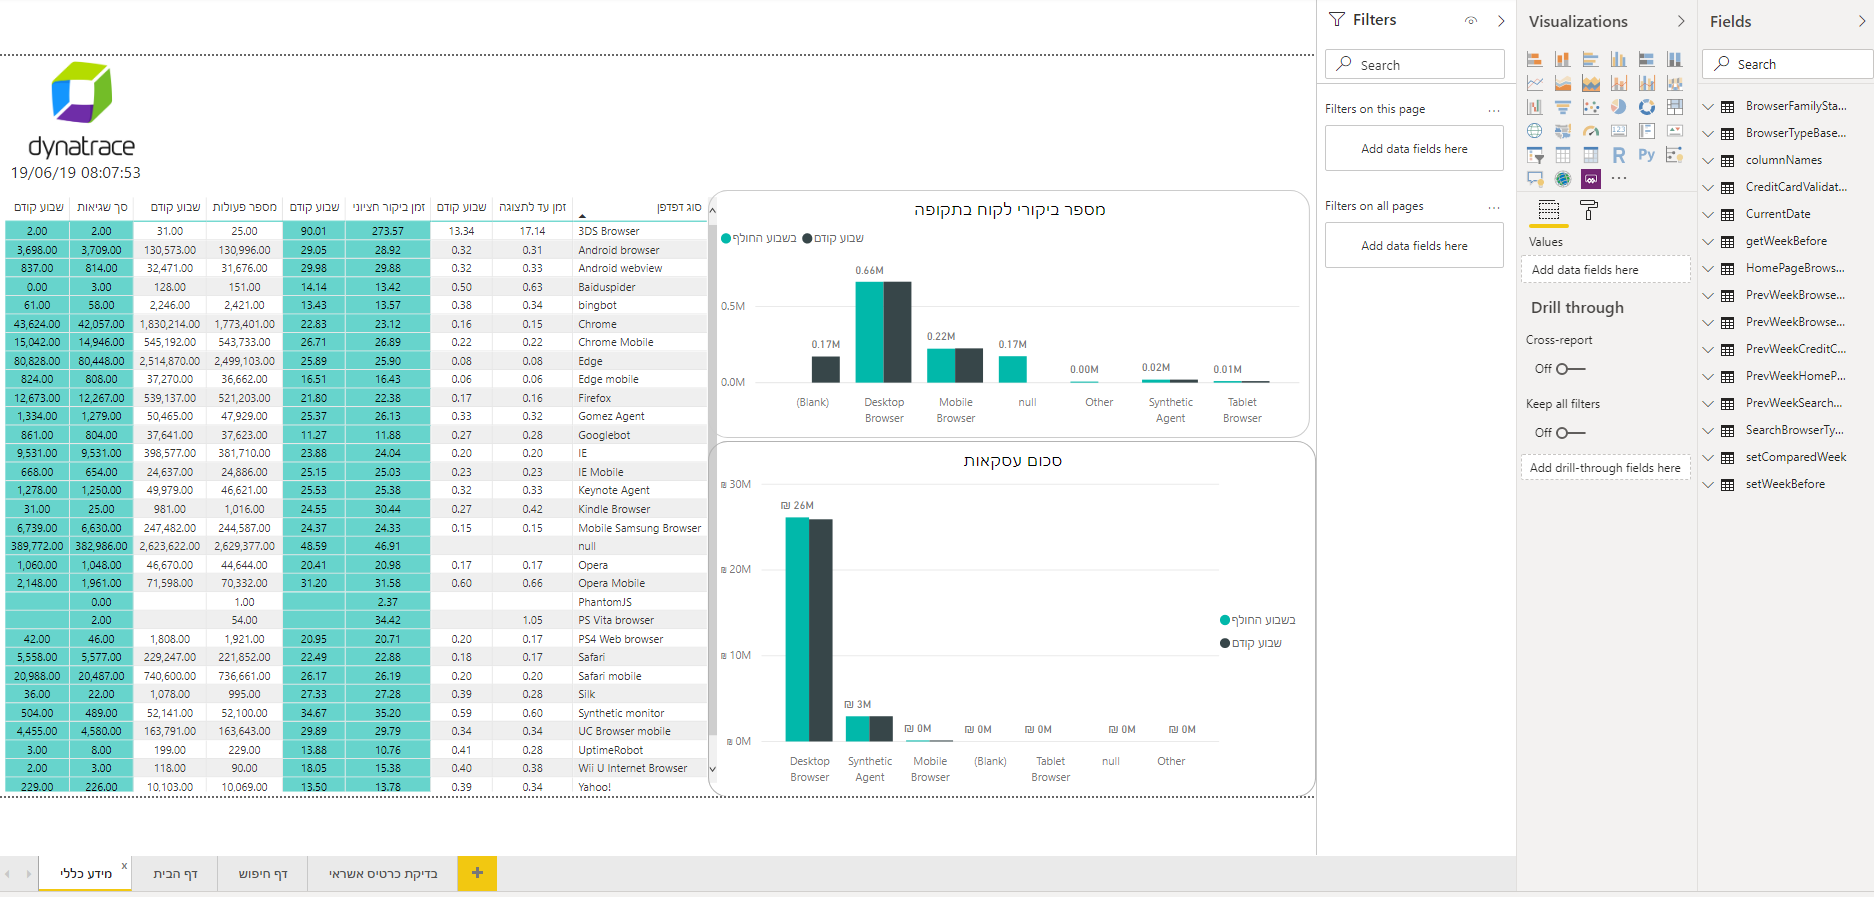
In the last example you can see on the right many queries used for the reports and green/black columns in charts represent time periods comparisons.
Hope this helps.
gil.
Reply
Options
- Mark as New
- Subscribe to RSS Feed
- Permalink
29 Apr 2020 08:24 PM
Thanks a lot Gil for taking out time and writing this. I will try it and will let you know.
Reply
Options
- Mark as New
- Subscribe to RSS Feed
- Permalink
20 Apr 2023 07:35 AM
Hoooooo Great !
Here is what we are looking for for building our entreprise "Control Tower". now we will be able to integrate Dynatrace Tiles in our PBI Reports !
very thanks for this post Gil ! and Take Care.
Options
- Mark as New
- Subscribe to RSS Feed
- Permalink
08 Jun 2020 03:28 PM
@Gil G Thanks for your help
it was very useful and worked for me.
Options
- Mark as New
- Subscribe to RSS Feed
- Permalink
23 Jun 2021 09:03 AM
I will be very grateful and appreciate if you can help to make some work around that
My personal Email: malaik.5@hotmail.com
My WhatsApp: 00966508181250
Thanks a lot
Sharing Knowledge
Options
- Mark as New
- Subscribe to RSS Feed
- Permalink
23 Jun 2021 02:40 PM
@Malaik- Please let me know what specific you are looking for. I can definitely assist you with that here.
Reply
Options
- Mark as New
- Subscribe to RSS Feed
- Permalink
23 Jun 2021 02:42 PM
Thanks @roushan_kumar1, I want to link Dynatrace to power BI from scratch.
Sharing Knowledge
Options
- Mark as New
- Subscribe to RSS Feed
- Permalink
23 Jun 2021 03:28 PM
@Malaik - You will need PowerBI desktop app + Dynatrace Tenant URL+ Dynatrace APi authorization token to start.
If you know basics of PowerBI then you should be good to go.
I will highly encourage you to watch the video- https://www.youtube.com/watch?v=PNX0jCL8AHc as suggested by @julien_duhamel1
In the video the real powerbi integration starts from 17:30. Give it a shot. If you still have any question after that I can assist further with that.

Touching the IT control process is getting more complicated especially with enterprises moving towards hybrid cloud environments. The effects - positively or negatively - of changes to infrastructure, services or applications are not always immediately known which makes it hard to assess the risk
Reply
Options
- Mark as New
- Subscribe to RSS Feed
- Permalink
24 Jun 2021 04:33 PM
@Malaik - Just checking do you still need any help?
Options
- Mark as New
- Subscribe to RSS Feed
- Permalink
30 Jun 2021 07:53 AM
Thanks @roushan_kumar1 for your time,
Yes Im trying some works, but Im blocked to download and Install, the customer blocked every thing.
Sharing Knowledge
Options
- Mark as New
- Subscribe to RSS Feed
- Permalink
23 Jun 2021
10:49 AM
- last edited on
24 Aug 2021
02:46 PM
by
![]() Karolina_Linda
Karolina_Linda
Hello,
Dynatrace Services offer a complete BI solution. I'm using it in my company, this a good way to democratize Dynatrace usage.
A Performance Clinic link: youtube.com/watch?v=PNX0jCL8AHc
Touching the IT control process is getting more complicated especially with enterprises moving towards hybrid cloud environments. The effects - positively or negatively - of changes to infrastructure, services or applications are not always immediately known which makes it hard to assess the risk
Reply
Options
- Mark as New
- Subscribe to RSS Feed
- Permalink
02 Sep 2021 01:23 AM
Does anyone by chance have a copy of the template from the video?
HigherEd
Options
- Mark as New
- Subscribe to RSS Feed
- Permalink
02 Sep 2021 07:10 AM
🤣

I asked my self the same thing, and was searching in the video's comments to try to find it.
I seems awesome one.
Sharing Knowledge
Options
- Mark as New
- Subscribe to RSS Feed
- Permalink
02 Sep 2021 01:58 PM
The template is not free, you will have to pay Dynatrace to get them.
Options
- Mark as New
- Subscribe to RSS Feed
- Permalink
04 Oct 2021 05:55 PM
Than you so much for the reply, unfortunate that Dynatrace does not provide the templates. By chance have you found a way to handle the "Next Page" process? I've begun pulling a lot of data using the API but I constantly run into the page limits.
Is there some automated way to have the Query call NextPage and gather all the data? Until then many of the reports I've built I can't fully use because they don't tell the full story.
HigherEd
Options
- Mark as New
- Subscribe to RSS Feed
- Permalink
24 Aug 2023 06:29 PM
Hi - I too am creating a Power Bi (PBI) dashboard, but want to include the Dynatrace usage & cost data for our entire instance, about 10 individual tenants. In starting with the PBI webconnector, will I need to somehow integrate 10 different URLs and API tokens into one PBI dashboard?
Featured Posts
