- Dynatrace Community
- Ask
- Open Q&A
- Re: How to chart number of IIS concurrent connections
- Subscribe to RSS Feed
- Mark Topic as New
- Mark Topic as Read
- Pin this Topic for Current User
- Printer Friendly Page
- Mark as New
- Subscribe to RSS Feed
- Permalink
14 Apr 2022
09:27 AM
- last edited on
07 Jul 2022
08:37 AM
by
![]() MaciejNeumann
MaciejNeumann
Hi guys,
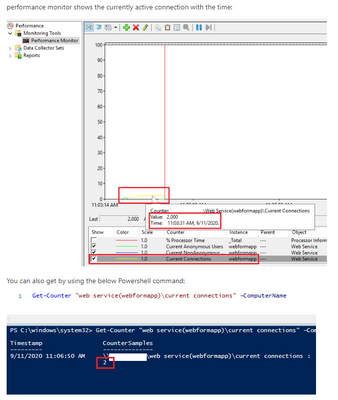
Customer monitoring their IIS with OA and request to chart the concurrent connections as shown in Performance Monitor but did not found any metric that hold this information.
Did we missed the right metric or we need to pull it with OA extension or any other way?
Here is a screen shot of the desired metric from PerfMon
Thanks in advance for your inputs
All the best and stay safe
Yos
Solved! Go to Solution.
- Mark as New
- Subscribe to RSS Feed
- Permalink
06 Jul 2022 09:41 PM
I am looking for the same thing. @Yosi_Neuman, were you able to figure it out?
- Mark as New
- Subscribe to RSS Feed
- Permalink
07 Jul 2022 06:28 AM
Hi @jetnyyanks ,
Yep, we created WMI extension that pulls this information from PerfMon.
Here is the WMI extension yaml we used:
  - group: PerfMon
    interval:
      minutes: 1
    dimensions:
      - key: host
        value: this:device.host
    subgroups:
      - subgroup: Connections
        query: SELECT Name, CurrentConnections FROM Win32_PerfFormattedData_W3SVC_WebService WHERE Name LIKE '_Total'
        metrics:
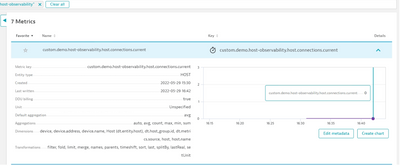
          - key: custom.demo.host-observability.host.connections.current
            value: column:CurrentConnections
And this is the metric we see in dynatrace
HTH
Yos
Featured Posts


