- Dynatrace Community
- Ask
- Open Q&A
- How to view all key requests?
- Subscribe to RSS Feed
- Mark Topic as New
- Mark Topic as Read
- Pin this Topic for Current User
- Printer Friendly Page
- Mark as New
- Subscribe to RSS Feed
- Permalink
08 Jun 2023
02:59 AM
- last edited on
13 Jun 2023
02:36 PM
by
![]() Ana_Kuzmenchuk
Ana_Kuzmenchuk
How to view all key requests defined in the environment. And then I can export it
Solved! Go to Solution.
- Labels:
-
key requests
-
request attributes
- Mark as New
- Subscribe to RSS Feed
- Permalink
08 Jun 2023 03:01 AM
It is best to have a corresponding service name
- Mark as New
- Subscribe to RSS Feed
- Permalink
08 Jun 2023 08:28 AM
Hi,
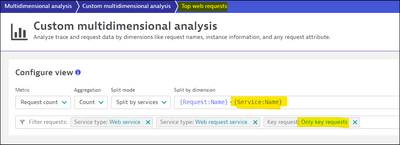
One option can be from multidimensional analysis:
- Filter only key requests.
- Add service name in split dimension.
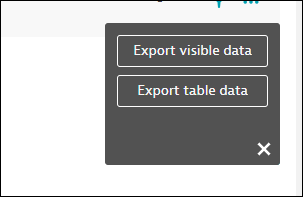
- Going down right and Export table.
Or using data explorer with table visualization, for example this query:
builtin:service.keyRequest.response.time:splitBy("dt.entity.service_method"):sort(value(auto,descending))Best regards
- Mark as New
- Subscribe to RSS Feed
- Permalink
08 Jun 2023 09:06 AM
Thank you very much, but this does not reach the final result I want. What I want is the key request of the whole environment, and I can only get a part of it through your method, which does not meet my expectations. Thank you very much for your reply.
- Mark as New
- Subscribe to RSS Feed
- Permalink
08 Jun 2023 09:14 AM
Thank you very much, your following example is what I want, if can attach the corresponding Srevice name, it would be best
- Mark as New
- Subscribe to RSS Feed
- Permalink
08 Jun 2023 09:53 AM
Hi,
You can add "parents" and service name appears in another column:
builtin:service.keyRequest.response.time:splitBy("dt.entity.service_method"):sort(value(auto,descending)):parentsYou can export it as CSV:
Best regards
- Mark as New
- Subscribe to RSS Feed
- Permalink
06 Jul 2023 09:18 AM
Is this showing only the top 100 key request?
- Mark as New
- Subscribe to RSS Feed
- Permalink
06 Jul 2023 09:35 AM
Yes, this method can only see 100, but the text at the bottom can see all of them
- Mark as New
- Subscribe to RSS Feed
- Permalink
06 Jul 2023 01:34 PM - edited 06 Jul 2023 01:35 PM
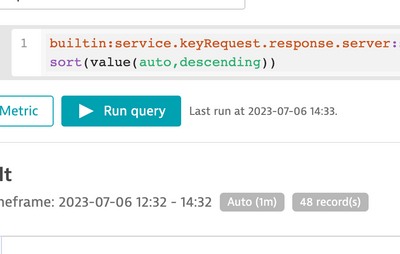
no, if there is no limit attached (in advanced mode) for a table then there should no limit apply and the result should show all tuples of service + request pairs. Potentially 1000+
e.g. I removed it here and the count jumped from 20 to 48. So in this environment, I have 48 defined key requests.
- Mark as New
- Subscribe to RSS Feed
- Permalink
06 Jul 2023 09:36 AM
builtin:service.keyRequest.response.time:parents:splitBy("dt.entity.service_method","dt.entity.service"):sort(value(auto,descending)):limit(500)
- Mark as New
- Subscribe to RSS Feed
- Permalink
07 Jul 2023 08:38 AM
Is there a way to adjust the limit? currently maximum is 100 as defined.
- Mark as New
- Subscribe to RSS Feed
- Permalink
07 Jul 2023 09:33 AM
TLTR: please switch to Table or Honeycomb, then you can change/remove the limit.
These are the two we believe are scalable with 1000+ items. All others would either suffer in terms of GUI performance or would often (e.g. graph) not make sense with more than 100 different lines, slices,... you would just not perceive any differences anymore.
A graph with 10 metrics (limit) would result in 1000 lines, which means you see almost nothing anymore. The visualization becomes meaningless.
- Mark as New
- Subscribe to RSS Feed
- Permalink
07 Jul 2023 01:01 PM
Are you on managed? I am guessing so and less than 1.266?
1.266 removes this limit.
Managed release notes: https://www.dynatrace.com/support/help/whats-new/release-notes/managed/sprint-266
SaaS release notes: https://www.dynatrace.com/support/help/whats-new/release-notes/saas/sprint-266
Data explorer and dashboard table enhancements
Platform | Data explorer
We have made the following improvements to the table visualization:
- Columns: In the Data explorer table visualization, use the checkboxes in the Columns section to enable and disable the display of columns. These selections are reflected in the resulting dashboard tiles.
- Rows: In the Data explorer, you can remove the limit to see more than 100 rows.
- Pages: In the Data explorer and resulting dashboard table tiles, tables are automatically paginated. Use the controls under the table to page through tables.
- Mark as New
- Subscribe to RSS Feed
- Permalink
11 Jul 2023 07:58 AM
This might be the reason why i am still getting the limit of 100. Our Manage Nodes are 3 updates away to 1.266 version.
- Mark as New
- Subscribe to RSS Feed
- Permalink
11 Jul 2023 12:15 PM
Yes, that would be it. Work with team to update to 266 or above. Some great new items that are beneficial.
- Mark as New
- Subscribe to RSS Feed
- Permalink
08 Jun 2023 01:12 PM
create a dashboard. I did this and copied the dashboard to each environment. i have added mine dashboard to this so you can use.
- Mark as New
- Subscribe to RSS Feed
- Permalink
09 Jun 2023 08:47 AM
Thank you for your reply. Thank you
- Mark as New
- Subscribe to RSS Feed
- Permalink
09 Jun 2023 09:12 AM
What a great dashboard you made! Can you share something else? Look forward to it
- Mark as New
- Subscribe to RSS Feed
- Permalink
09 Jun 2023 12:20 PM
Share something else? what you need?
- Mark as New
- Subscribe to RSS Feed
- Permalink
12 Jun 2023 03:16 AM
Sorry for not replying to your message in time. You made a great dashboard. I don't have any specific needs at the moment, I just want other refined and simple dashboards. Of course, if it's too much trouble, don't. Thank you very much for your reply.
- Mark as New
- Subscribe to RSS Feed
- Permalink
12 Jun 2023 01:14 PM
No worries, just trying to help where I can. They do have a lot of dashboards pre built that you can pull at https://dynatrace.github.io/BizOpsConfigurator/#home
I have used that for many dashboards.
- Mark as New
- Subscribe to RSS Feed
- Permalink
25 Jul 2024 07:40 PM
Has anyone done this in Grail? I think it is possible and I got some result. Just not complete result yet.
I am working with Dynatrace to come up with a solution in Grail.
Featured Posts


