- Dynatrace Community
- Dynatrace
- Ask
- Open Q&A
- Re: Interpreting process TCP request metrics
- Subscribe to RSS Feed
- Mark Topic as New
- Mark Topic as Read
- Pin this Topic for Current User
- Printer Friendly Page
Interpreting process TCP request metrics
- Mark as New
- Subscribe to RSS Feed
- Permalink
08 Mar 2021 02:42 PM
Hi,
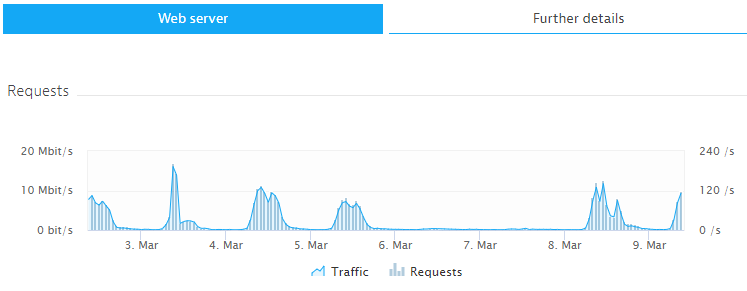
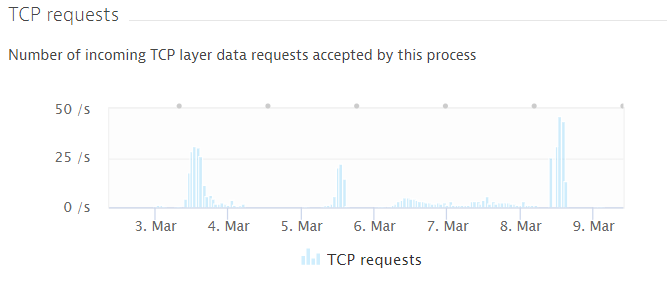
I'm trying to understand the traffic volumes incoming per each IIS node. There are dozens of services running on these, so instead of looking at the throughput one by one per each service, I'm trying to get a higher level view from the process level. There's a clear correlation between the metrics for process traffic and web server traffic - even though the latter is only one tenth of the former. But then looking at the TCP requests for the process, it seems to only calculate some requests into that category. For example before 10 and after 10:30, it actually drops to zero - which is exactly the opposite of what the first 2 metrics are reporting. Does anyone make any sense of this data?
- Mark as New
- Subscribe to RSS Feed
- Permalink
08 Mar 2021 07:02 PM
Are the 3 graphs from the same tile? In the traffic part of a IIS process, I can't see the Requests graph that you show above...
- Mark as New
- Subscribe to RSS Feed
- Permalink
08 Mar 2021 07:41 PM - edited 08 Mar 2021 07:41 PM
Hi Antonio,
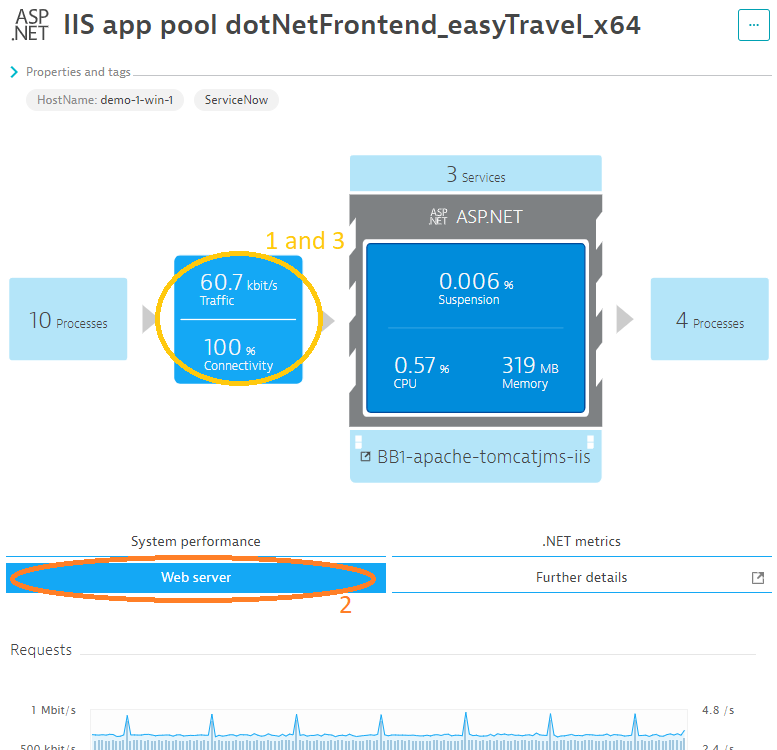
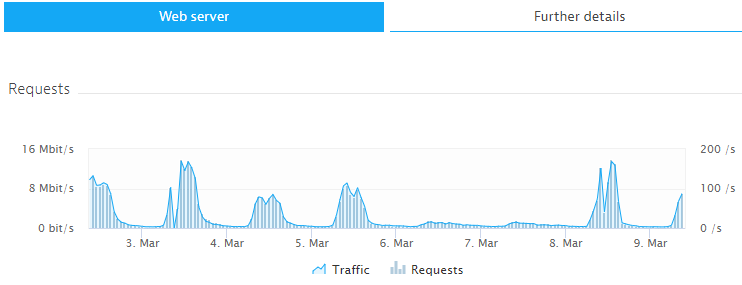
Nope, they're not all from the same tile. The first and last pics are from the Network section of the IIS process. The middle one is found by activating the main process infographic and then selecting the "Web server" tab. Here's an example from the demo environment:
- Mark as New
- Subscribe to RSS Feed
- Permalink
09 Mar 2021 07:18 AM - edited 09 Mar 2021 07:21 AM
Hello @kalle_lahtinen
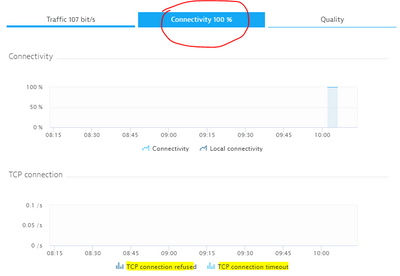
It seems there were TCP connection refused/timeout. Can you check the connectivyt tab for the verification?
Regards,
Babar
- Mark as New
- Subscribe to RSS Feed
- Permalink
09 Mar 2021 07:36 AM
Hi Babar,
There have been no TCP connections refused or timeouts. That was the first thing I checked 🙂 FYI, this is a quite important, widely used production app so even a small amount of connection errors like that would be a major incident. Nothing like that happening here.
I'm starting to think that the TCP requests metric is just not correctly measured for this "node 1" - node 2 is ok. Here's a comparison over the past 7 days (you can see less usage over the weekend):
Node 1 - for "TCP requests", it's as if some days are entirely missed, the data is not gathered:
Node 2 - the graphs look identical:
So I guess the solution is that I should just use the web server metrics to analyze this, and ignore "TCP requests" metrics for node 1, because that measurement is somehow broken..?
- Mark as New
- Subscribe to RSS Feed
- Permalink
09 Mar 2021 07:54 AM
Hello @kalle_lahtinen
You are right. If the agent/webserver versions are the same then the douting on measurement may not help us out to understand this behavior.
How were the active threads behaving on both webservers?
Regards,
Babar
- Mark as New
- Subscribe to RSS Feed
- Permalink
09 Mar 2021 08:06 AM
Hi,
Web server -> Active threads
and
.NET metrics -> Thread pool
show similar behavior on both nodes. Looks like there's just trouble collecting that TCP Requests data. I guess the way that is collected is different compared to the .NET and Web server metrics, because "TCP requests" is a sort of basic metric that's available for all process types, even of type "Other".


