This website uses Cookies. Click Accept to agree to our website's cookie use as described in our Privacy Policy. Click Preferences to customize your cookie settings.
Open Q&A
If there's no good subforum for your question - ask it here!
Turn on suggestions
Auto-suggest helps you quickly narrow down your search results by suggesting possible matches as you type.
- Dynatrace Community
- Ask
- Open Q&A
- Pure Path Time that is not listed in Timings but is on the Graph
Options
- Subscribe to RSS Feed
- Mark Topic as New
- Mark Topic as Read
- Pin this Topic for Current User
- Printer Friendly Page
Options
- Mark as New
- Subscribe to RSS Feed
- Permalink
30 Sep 2020
06:54 PM
- last edited on
11 Dec 2024
01:56 PM
by
![]() MaciejNeumann
MaciejNeumann
I have a pure path graph that looks like this:
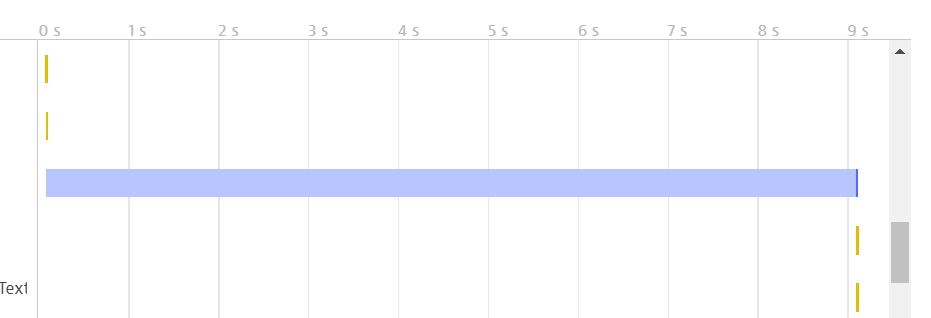
As you can see, it has 9 seconds of "Client Side Response Time".
It seems to indicate that when I select this bar and go to the timings tab, it would give me a break down of the time in the bar. (In the example they have it shows that it is a Network Issue.)
But when I go to the timings tab for this bar, the time of the "Client Side Response Time" is not represented:
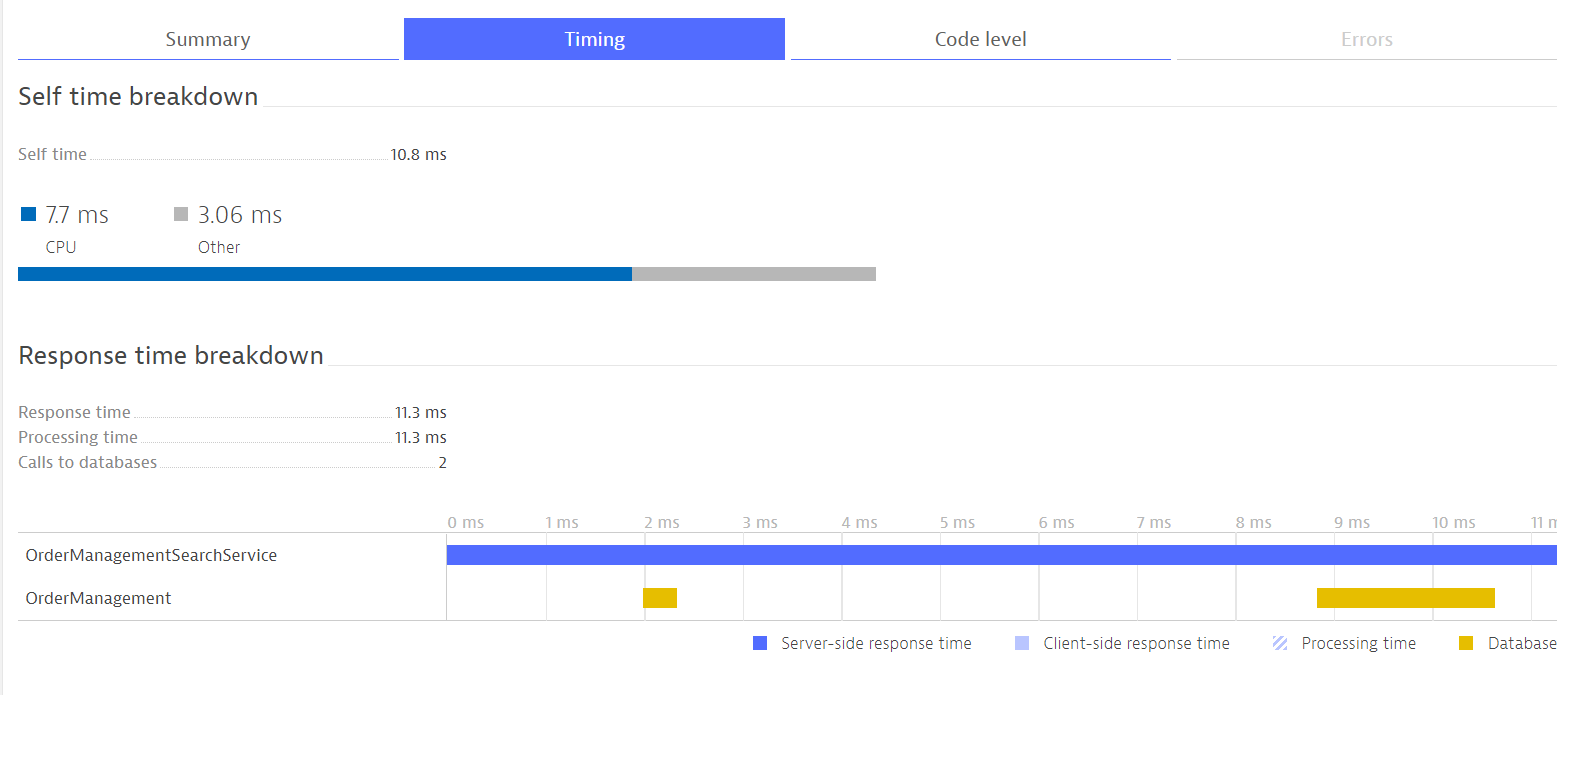
As you can see, it shows 11 ms. The part of the request at the very end. (The part that performed just fine.)
The part of the call that I need the information on is has just disappeared!
How can I get more details on the the 9 seconds of "Client Side Response Time"?
Solved! Go to Solution.
Labels:
- Labels:
-
distributed traces classic
1 REPLY 1
Options
- Mark as New
- Subscribe to RSS Feed
- Permalink
30 Sep 2020 07:27 PM
The light blue 'client side' time is when the caller (e.g. calling service) reached out to the called service and started the stopwatch. The dark blue "server side" response time is when the called service and actually started processing the request (i.e starting a timer when it actually received it). So that time is in neither service directly and we can't show any code level data for it. We can only show time once the receiving side started processing it.
Depending on what's between these two services it could be network/routing time or something along those lines, or something like internal OS/App server time holding on to the request before passing it to called service. For example I saw once where it was some asynchronous activity in the background and it was a long time before processing actually continued. What exactly it is depends on the nature of the environment and this communication.
Featured Posts
