This website uses Cookies. Click Accept to agree to our website's cookie use as described in our Privacy Policy. Click Preferences to customize your cookie settings.
Open Q&A
If there's no good subforum for your question - ask it here!
Turn on suggestions
Auto-suggest helps you quickly narrow down your search results by suggesting possible matches as you type.
- Community Home
- Platform
- Open Q&A
- Re: what is service client-side response time ?
Options
- Subscribe to RSS Feed
- Mark Topic as New
- Mark Topic as Read
- Pin this Topic for Current User
- Printer Friendly Page
Options
- Mark as New
- Subscribe to RSS Feed
- Permalink
01 Apr 2018
06:38 PM
- last edited on
24 Aug 2021
02:40 PM
by
![]() Karolina_Linda
Karolina_Linda
I have confusion in understanding what is service client side response.
1. Is it the time taken at network layer? OR
2. Is it the time taken for downloading client side resources like js, css , images etc. OR
3. Is it the time taken by the caller of that request ?
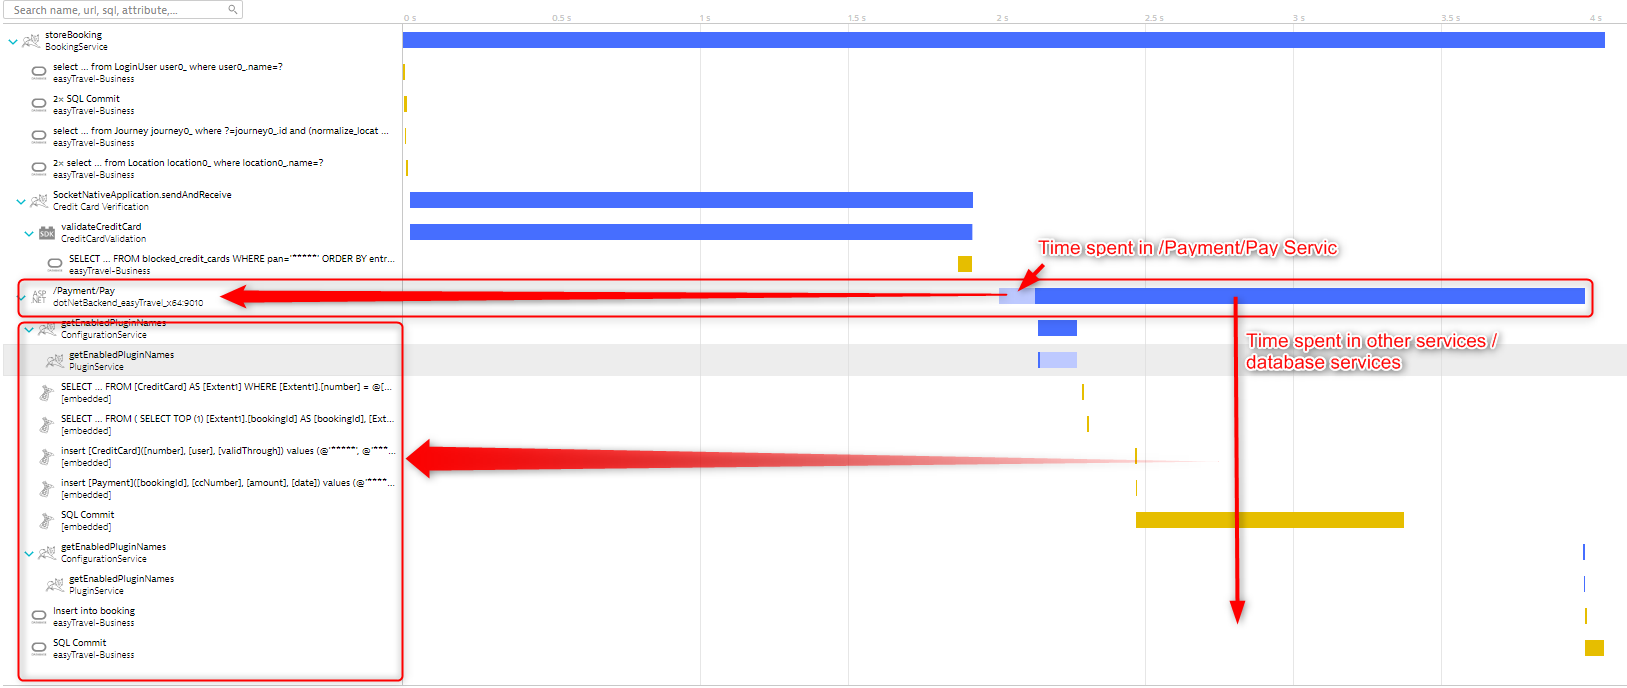
In the chart below I am referring to light blue bar.

4. How should I proceed with analyzing the root cause of client side response time?
Solved! Go to Solution.
Labels:
- Labels:
-
services classic
14 REPLIES 14
Options
- Mark as New
- Subscribe to RSS Feed
- Permalink
20 Aug 2018 02:32 PM
In this context the client and server terms are referring to client and server "services." It is helping to understand and visualize where time is spent in your detected services and database services (database calls). In a PurePath there will be links between services as one service calls another or calls a database.
For a given service the time spent before returning within itself is the client-side service time whereas the time spent in the services or databases they call (and the services those services call) are attributed to server-side service time.
So if Service A calls Service B which calls Service C before returning something for Service A, for Service A the time spent in the code of Service A is it's client-side service time and the time spent in Service's B and C is the the server-side service time since Service A is the client-side service in that interaction.
James
Reply
Options
- Mark as New
- Subscribe to RSS Feed
- Permalink
20 Aug 2018 05:21 PM
Hi James,
Great answer and thanks! Is there any plan to include this in the documentation soon?
Options
- Mark as New
- Subscribe to RSS Feed
- Permalink
20 Aug 2018 06:36 PM
I can forward a link of this thread to the team that handles documentation for review.
James
Options
- Mark as New
- Subscribe to RSS Feed
- Permalink
17 Oct 2018 03:00 PM
Hi @James K.,
Thank you for the answer, but I am still not sure if this right definition for client-side response time.
For example, if we have Service A that calls Service B1 and Service B2 like on the screenshot:
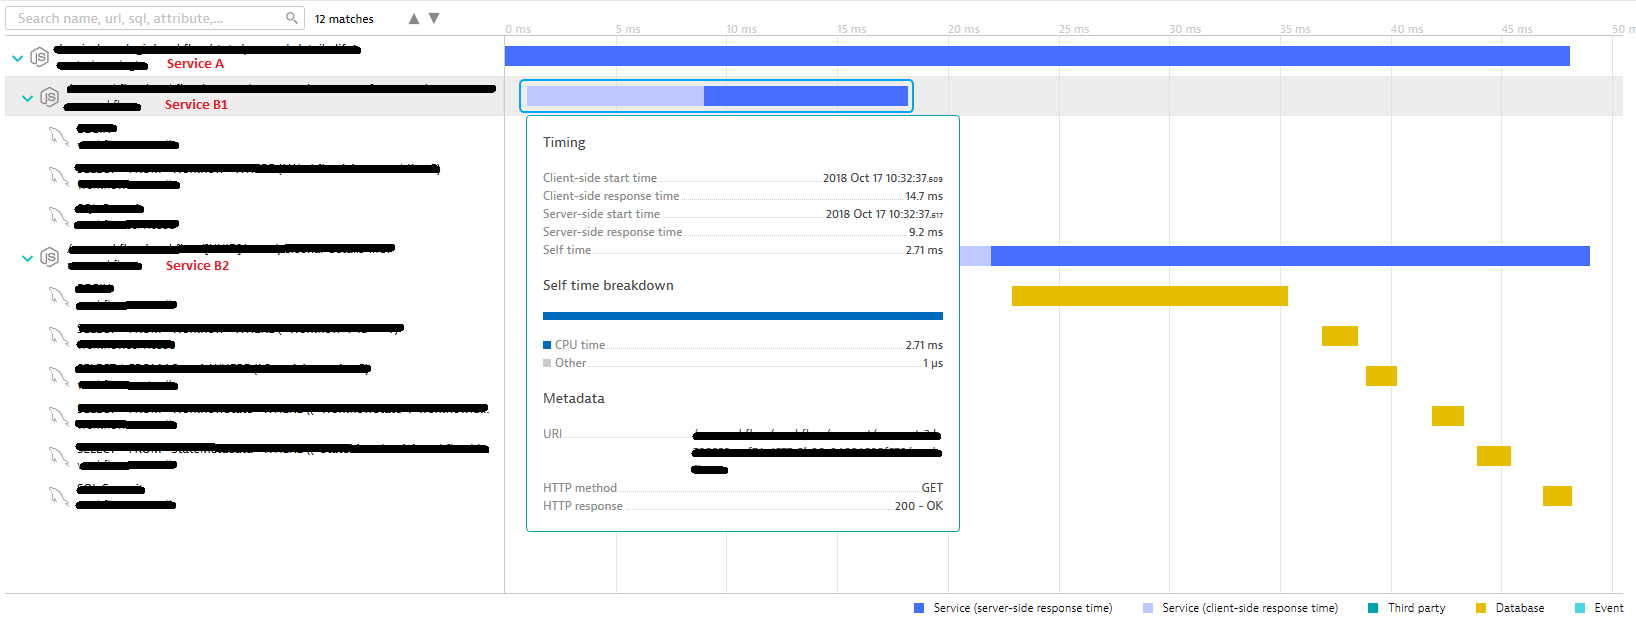
In this case, the client-side response time for Service B1 is 14.7ms:
- If that is the time spent in the code of Service B1, what is Self-time?
- Does client-side response time include server-side response time or those two times overlaps somehow? (this is my conclusion based on UI representation on the chart)
- Is it possible that client-side response time belongs to Service A and that is somehow time spent for executing the request’s code in Service A?
Sorry for bothering you, just wanted to be sure about this, because it is important for performance analysis.
Options
- Mark as New
- Subscribe to RSS Feed
- Permalink
17 Oct 2018 04:58 PM
I spent some time thinking this through and I am trying to confirm some of this but let me put this out there as it makes sense based on the the more I look into examples.
- Self-time will be the time spent executing the code for that service alone. In the timing tab (which is very useful to visualize all of this) among other places you'll see the breakdown by things like cpu, wait, suspension, and "other" time. Other can be things like network time, or time accessing disk.
- Now, server-side response time will be the response time from the perspective of the service itself (how much time was executing that service and any downstream services it may call.
- Client-side response time will be the response time of that same service but from the perspective of the client service that called it. So any client-side time at the beginning is time from when the client service called the service to when the service began executing and client-side time at the end will indicate time from when the service finished executing and returned its value to when the client service received that return value (so it can time spent anywhere between those services and will likely be something like time traversing the network and any devices in the middle).
So in your example, the client side response time is 14.7 ms because from when the client service A called B1 the response time of B1 was 14.7 ms, but B1 only saw it should execute after a number of ms and from when it actually started to when it finished was only 9.2 ms - the rest of the time in the light blue bar would be something else upstream. A self time of 2.7 ms says to me that is how much time was actually spent in the code for B1 itself (the rest looks like DB activity).
Does that make sense? Thanks for noting something didn't seem correct.
Reply
Options
- Mark as New
- Subscribe to RSS Feed
- Permalink
17 Oct 2018 07:08 PM
Hi James,
Thank you for quick response.
I think I got the your point about client-side response time.
The only thing that is still a little bit unclear to me, is relationship between client-side and server-side response time. It is logical to me that client-side includes server-side response time.
So, from my example 9.2 ms is included into 14.7 ms, and there is 14.7-9.2=5.5 ms lost somewhere (traversing the network or something like that).
But if you look at the chart from my example, there is some inconsistency there:
- Client-side start time is 10:30:37.609 (or 1 ms from start) - visible on chart
- Server-side start time is 10:30:37.617 (or 9 ms from start) - visible on chart
- So, 6.7 ms of client-side time will overlap with server-side time - NOT visible on chart
- Client-side end time will be ~10:30:37.624 (or 16 ms from start) - NOT visible on chart
- Server-side end time will be ~10:30:37.626 (or 18 ms from start) - visible on chart
So, based on topics above, client-side time will finish before server-side time which is strange to me? In this case client-side time should finish at the same time like server-side ~ 10:30:37.626 (or 18 ms from start), so duration of client-side response time should be ~17 ms.
Do you see some wrong logic here, maybe I missed something?
Options
- Mark as New
- Subscribe to RSS Feed
- Permalink
17 Oct 2018 08:58 PM
I think I see what you mean and I can't explain that - first thought is that with such small levels if there's any rounding maybe it gets funky. Regardless, I'm gonna look into it more as I want to understand it better as well.
Options
- Mark as New
- Subscribe to RSS Feed
- Permalink
17 Oct 2018 09:11 PM
Thanks for your help. I will also try to find the answer for this.
Options
- Mark as New
- Subscribe to RSS Feed
- Permalink
17 Oct 2018 09:15 PM
Just got some possible explanations - if these services are on different hosts it could be as simple as a time sync issue. The start times you see there will be server time and with such low times it's possible that is if they are slightly different you can see anomalies like that.
If the services are on the same host though the recommendation I got was to open a ticket so it can be investigated. Regardless, I'm pretty confident the general explanation I provided is correct but will update if I find anything new.
Reply
Options
- Mark as New
- Subscribe to RSS Feed
- Permalink
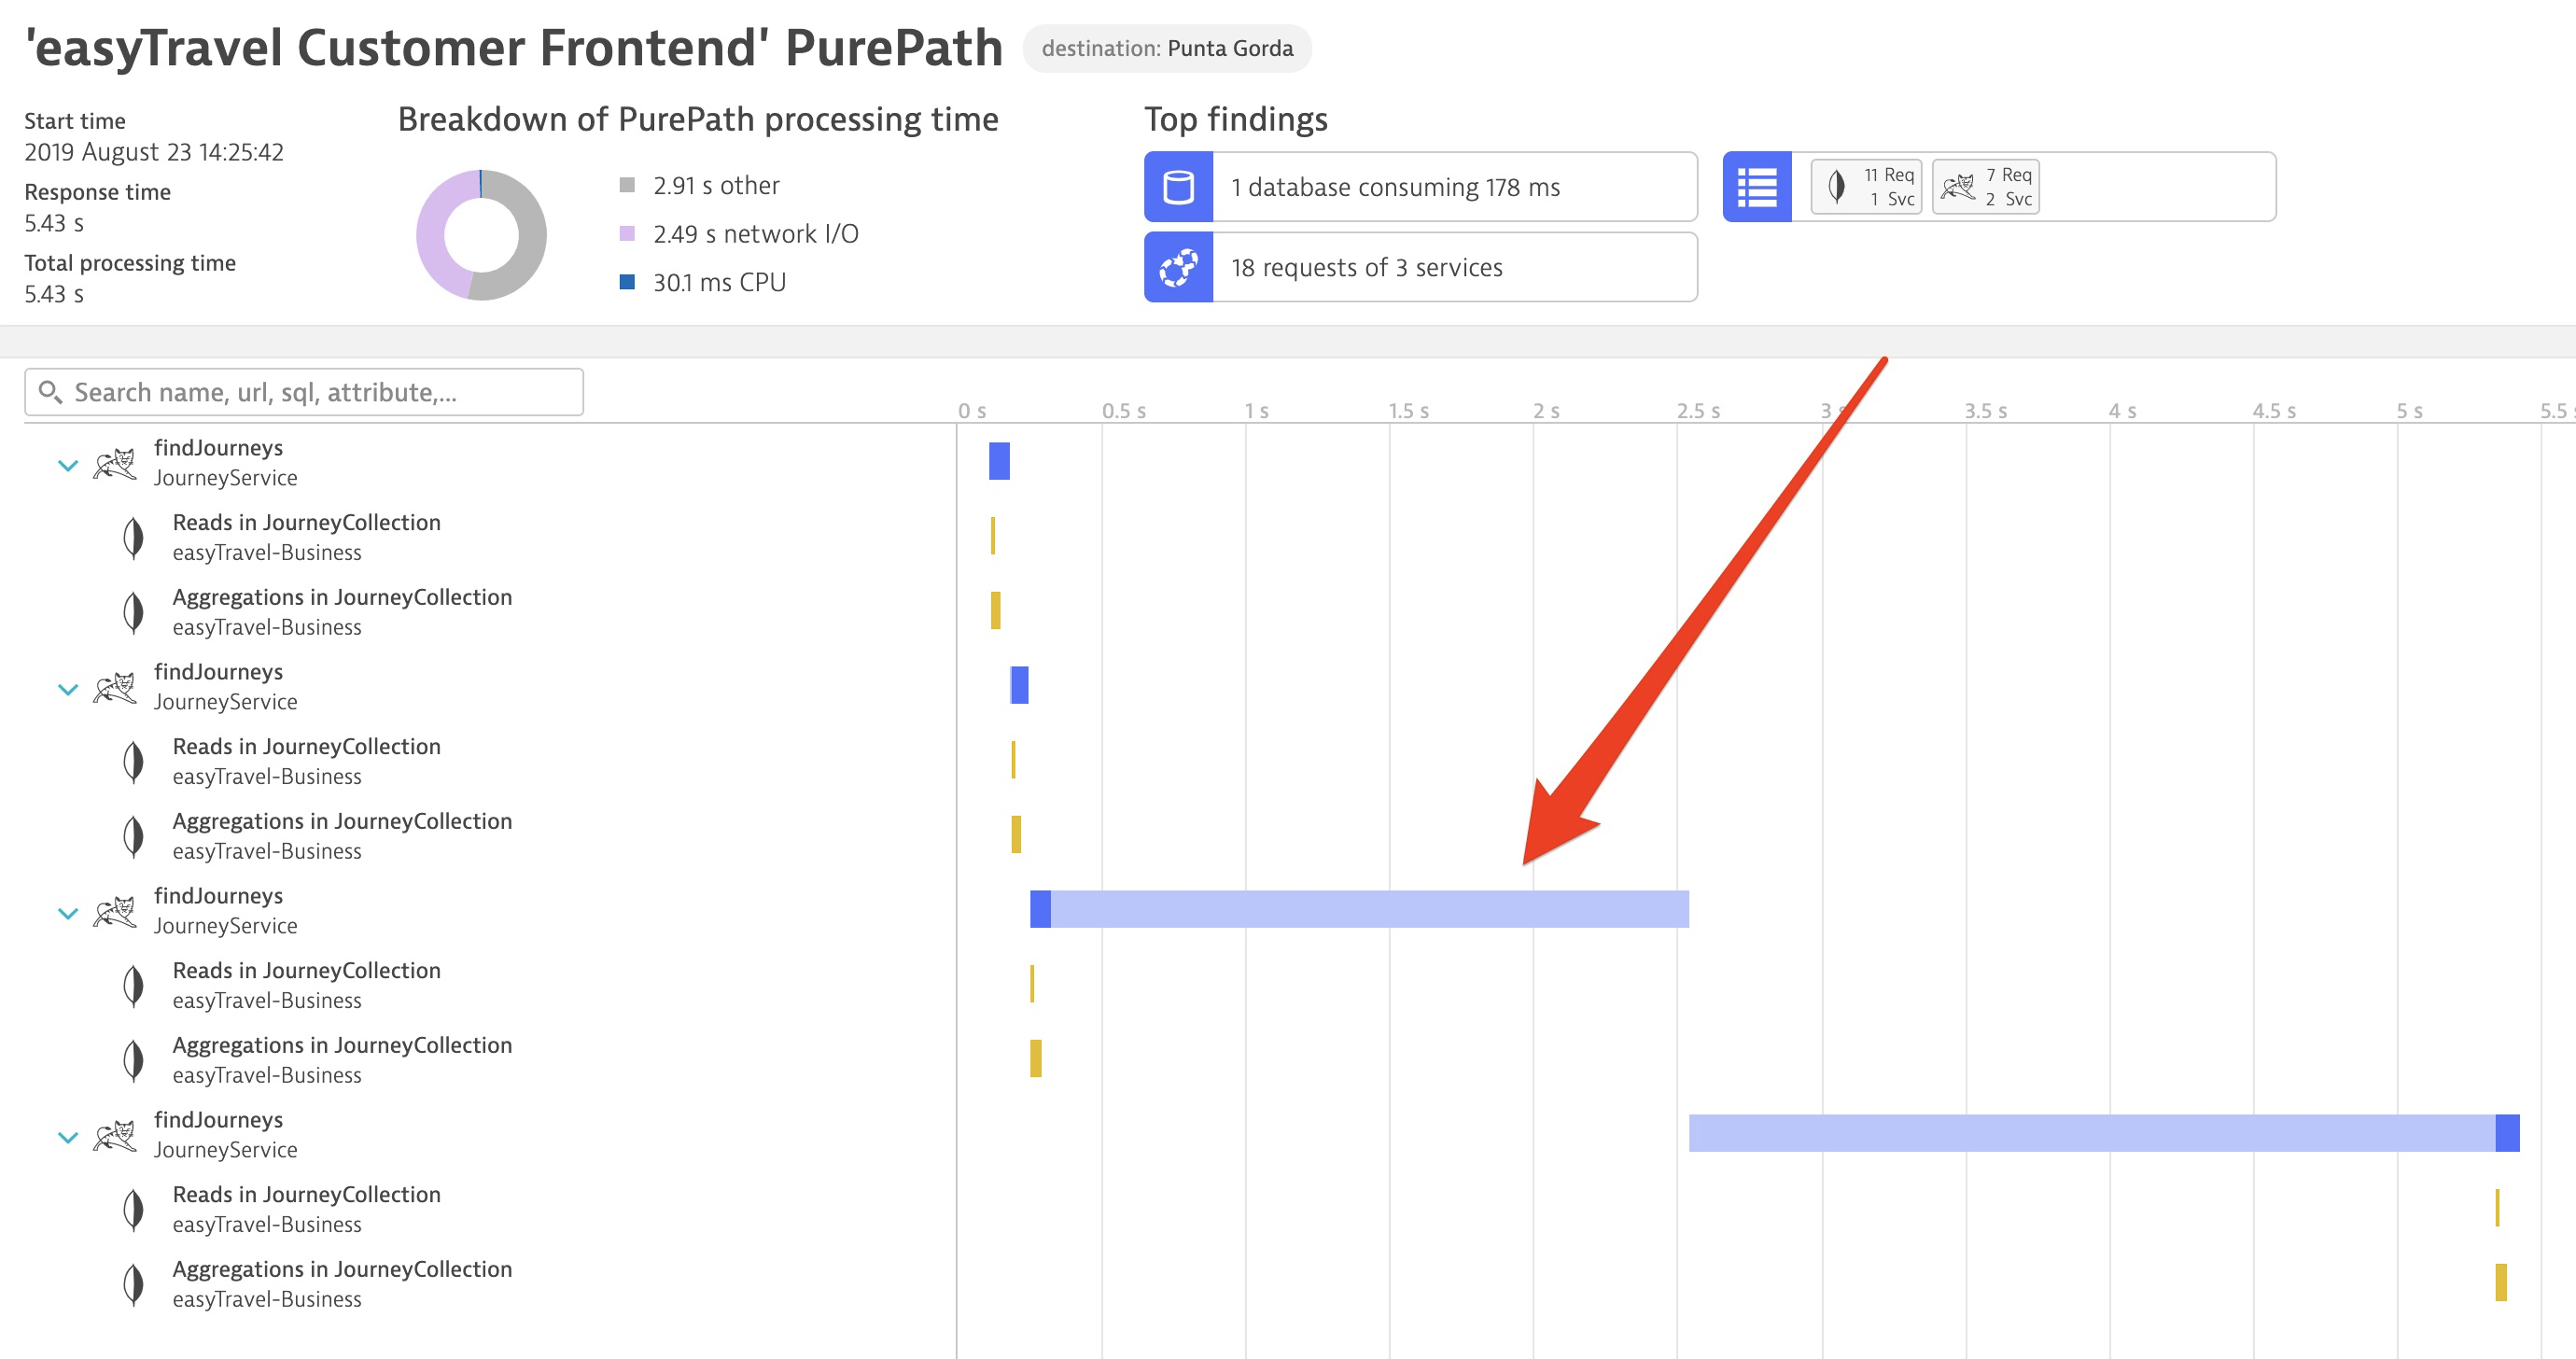
23 Aug 2019 02:03 PM
Hi all
Here I have interesting PurePath with big client-side response time between services, which are running on one host on containers. I cannot explain such big numbers. Can anybody help me please?
Options
- Mark as New
- Subscribe to RSS Feed
- Permalink
23 Aug 2019 02:08 PM
Hi Vlad
Please see exemplary explanation shown here https://www.dynatrace.com/support/help/how-to-use-dynatrace/services-and-transactions/analysis/purep...
"According to the example above, most of the time of this particular request was spent on the client side of the getLoyaltyStatus web service call. As indicated by the colors of the bars in the chart, the time was not spent on the server side of this web service but rather on the client side. If we were to investigate this call further, we would find underlying network latency. "
Options
- Mark as New
- Subscribe to RSS Feed
- Permalink
23 Aug 2019 02:31 PM
Hi Janusz
I can understand if client-side RT is before Server-side RT as @James K. wrote here
So any client-side time at the beginning is time from when the client service called the service to when the service began executing
But I cannot understand then client-side RT is at the end just right after server-side RT and the services are running on the same host in docker containers
Options
- Mark as New
- Subscribe to RSS Feed
- Permalink
05 Aug 2022 08:54 AM

Hello everyone,
I saw that Purepath had an example of this, Service A's (the first Tomcat's service) "Client-side response time" had 20.3 seconds, but the "self-time" was only 80.6ms.
I looked at this thread and knew that 20.3 seconds was spent in "Service A", but overall I still don't know where to check "Serivce A" to explain or improve the response time.
Does anyone have a similar experience that can help me?
Options
- Mark as New
- Subscribe to RSS Feed
- Permalink
08 Aug 2022 09:44 PM
@owen_chen it really depends on what the service A and the called service. The difference represents the time spent between the time service A initiated the request and the time the request processing on called service was started.
It can be basically anything. Be also sure to check the code level tab here and also verify if you have all application components between calling and called service covered by OneAgent.
Dynatrace Ambassador | Alanata a.s., Slovakia, Dynatrace Master Partner
Reply
Featured Posts
