- Dynatrace Community
- Ask
- Open Q&A
- difference Request count vs Request count - server vs Request count - client
- Subscribe to RSS Feed
- Mark Topic as New
- Mark Topic as Read
- Pin this Topic for Current User
- Printer Friendly Page
- Mark as New
- Subscribe to RSS Feed
- Permalink
20 Apr 2021 01:06 PM
Hello
help me understand the difference between metrics:
- Request count - builtin:service.requestCount.total
- Request count - server - builtin:service.requestCount.server
- Request count - client - builtin:service.requestCount.client
- Number of calls to other services -builtin:service.keyRequest.nonDbChildCallCount
And why these metrics have different meanings on the Custom chart and Service Details page/Service Flow?
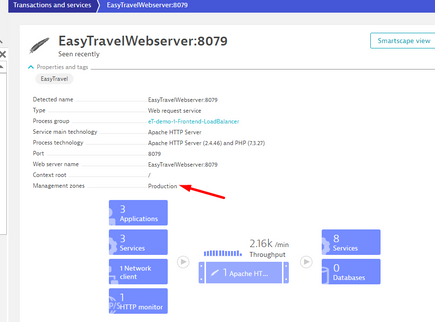
as an experiment to understand the metrics, I took the EasyTravelWebserver service: 8079
I userd service for MZ=production
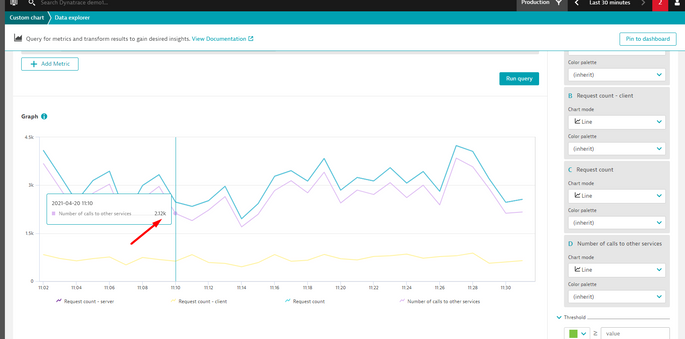
I selected metrics and displayed them on the chart
I took the value in 11-10 and compared them for different metrics
- Request count - builtin:service.requestCount.total
- Request count - server - builtin:service.requestCount.server
- Request count - client - builtin:service.requestCount.client
- Number of calls to other services -builtin:service.keyRequest.nonDbChildCallCount
result
- Request count = 2470
- Request count - server = 2470
- Request count - client = 627
- Number of calls to other services = 2120
conclusions:
- Request count =Request count - server
- Request count - server > Request count - client
- Request count > Number of calls to other services
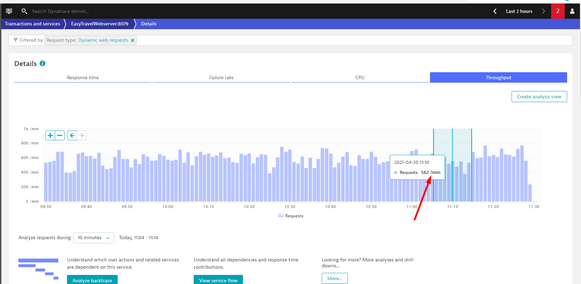
I decided to compare this value with the value on the Detail page
(chose the value on the chart to correspond to a 1 minute interval)
to my surprise, I saw a value of 562 which is not equal to that of the previous
what does it mean ?
I understand what the metric means - Number of calls to other services
its value can be seen in the service flow
I decided to compare this value with the value on custom charts
took the interval from 11-00 to 11-30
- Request count - server
- Request count - client
- Number of calls to other services
result
- Request count - server = 92.6K
- Request count - client = 21.2K
- Number of calls to other services = 81K
- ServiFlow Call to caller service = 77.1
- ServiFlow Request =77,3
conclusions:
- Request count not equal ServiFlow Request
- ServiFlow Call to caller service not equal Number of calls to other services
Could you help me understand the difference between metrics
Solved! Go to Solution.
- Labels:
-
metrics
- Mark as New
- Subscribe to RSS Feed
- Permalink
05 May 2021 02:31 PM
This is the reply I got from Support:
- Mark as New
- Subscribe to RSS Feed
- Permalink
05 May 2021 02:38 PM
also forgot to mention for the last metric It refers to Key requests, not regular requests.
Featured Posts


