- Dynatrace Community
- Ask
- Real User Monitoring
- Re: Communication test fails from mobile agent to SaaS Security Gateway (now ActiveGate)
- Subscribe to RSS Feed
- Mark Topic as New
- Mark Topic as Read
- Pin this Topic for Current User
- Printer Friendly Page
- Mark as New
- Subscribe to RSS Feed
- Permalink
29 Aug 2018 09:46 PM
We are running a Dynatrace SaaS POC, we instrumented the Android agent
and we want to test the communication between mobile OneAgent and the security
gateway because we are not getting any data on the interface. In the
documentation I found that we can run the test this way:
Using a mobile device browser,
confirm if OneAgent configuration requests deliver a valid response. For
example, https://<psg-url>:<port>/mbeacon/<environment..
id>?type=m&app=<app id>
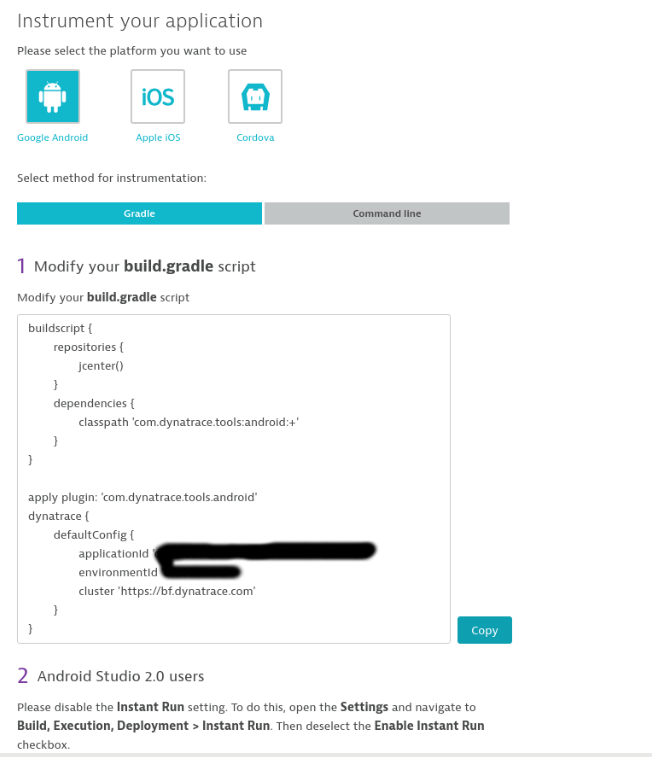
This is the cluster URL that I got from the instrumentation page:
DTXClusterURL=https://bf.dynatrace.com
So I tried to run the test with the next URL from the mobile browser:
https://bf.dynatrace.com:9999/mbeacon?type=mt
But it fails, I'm not getting the timestamps, why?
Solved! Go to Solution.
- Mark as New
- Subscribe to RSS Feed
- Permalink
29 Aug 2018 10:56 PM
Use the syntax described in the doc and it should work.
https://www.dynatrace.com/support/help/deploy-dyna...
Specifically you need something like the following:
https://<tenant>.live.dynatrace.com/mbeacon/<envID>?type=m&app=<appID>
EnvID and AppID are found in the Mobile Application setup screen when setting up (or editing) your mobile app.
BTW: You will not get timestamps back, but rather something like:
type=m&id=5&bl=150
- Mark as New
- Subscribe to RSS Feed
- Permalink
06 Sep 2018 09:50 PM
@Patrick H.The syntax that worked was:
https://<environmentID>.bf.dynatrace.com/mbeacon?type=mts
It seems that now it uses the port 443 and not 9999 por SaaS
- Mark as New
- Subscribe to RSS Feed
- Permalink
30 Aug 2018 06:57 AM
the bf url uses the ELB, so in this case it would be
https://<environmentID>.bf.dynatrace.com:9999/mbeacon?type=mts
- Mark as New
- Subscribe to RSS Feed
- Permalink
30 Aug 2018 12:51 PM
So I guess this is why I'm not getting any monitoring data, I have to use this syntax in the instrumentation right? this is not specified in the documentation.
- Mark as New
- Subscribe to RSS Feed
- Permalink
30 Aug 2018 01:35 PM
you just have to set the right properties for instrumenting a mobile app like it is shown in the Dynatrace WebUI when you add a mobile app and follow the instrumentation steps.
There is no need to manually construct that url pattern - all settings can be copy pasted from webUI
- Mark as New
- Subscribe to RSS Feed
- Permalink
30 Aug 2018 03:30 PM
OK, but the Cluster URL in the WEBUI is not with the envID and the port, as you can see in the image, so I leave like this? I have seen the same cluster URL with different tenants

- Mark as New
- Subscribe to RSS Feed
- Permalink
31 Aug 2018 11:52 AM
this is the configuration as you need it for the instrumentation - the agent builds the URL it needs from the properties as URLs for SaaS and managed differ
- Mark as New
- Subscribe to RSS Feed
- Permalink
31 Aug 2018 03:24 PM
Thanks for your help @Patrick H.
Featured Posts
