- Dynatrace Community
- Ask
- Real User Monitoring
- Re: Dynatrace RUM metrics meaning
- Subscribe to RSS Feed
- Mark Topic as New
- Mark Topic as Read
- Pin this Topic for Current User
- Printer Friendly Page
Dynatrace RUM metrics meaning
- Mark as New
- Subscribe to RSS Feed
- Permalink
01 Sep 2021
12:42 PM
- last edited on
07 Sep 2021
08:52 AM
by
![]() MaciejNeumann
MaciejNeumann
Hello,
Last few days I’ve been looking at the “Page Load Cycle” diagram and explanations provided at https://www.dynatrace.com/support/help/how-to-use-dynatrace/real-user-monitoring/basic-concepts/user..., and the more I look the less sense it makes to me. I also read some related materials at w3.org and other resources but still struggle to find reliable answers on my questions. I would appreciate if someone could help me with them.
- Redirect time.
I’ve got at least one application where total most of end users operations happen in the following scenario: when the user hits the button, its browser sends POST request with the full context of the request. When this request is partially processed, the application server sends “HTTP 302 Moved Temporarily” reply. The client fetches the resulting data following this redirection with GET request that triggers another part of business logic processing at the application server. Both parts contain server processing time and network time.
a. How such request would be treated in Dynatrace RUM?
b. What URL and parameters would be considered as a “Request” and which part of business logic processing would be taken for PurePath analysis?
c. Would it be possible to properly assess network transferring time and server processing time for the front-end interface of this kind? - Incorrect network time assessment in Dynatrace RUM.
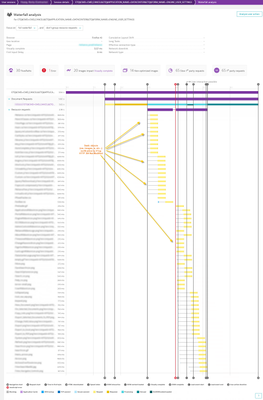
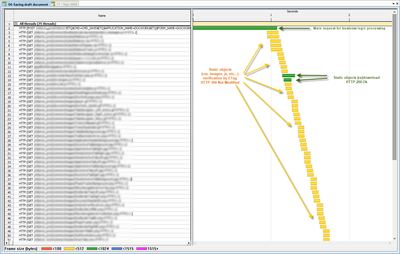
No need to go far to find evidence for that. Looking at the waterfall diagram of usual operation we can see its overall delay might highly depend on multiple static objects (.css, .jpeg, .js, etc.) download (HTTP 200 Ok) or verification (HTTP 304 Not Modified). Usually this starts at the end or near the end of main business logic operation execution and lasts far after the client received the last byte of it. Here there are few examples.
All these static elements were delayed by the network (for at least for network Round Trip Time at HTTP 304 Not Modified), but Dynatrace considers this delay as a front-end time rather than network time. Why?
3. App cache.
Usually all the static objects that require to render the page loads after the client executed its main business logic request, or closer to the end of main request processing. That is what I could see inspecting the network traces, looking at Dynatrace RUM waterfall diagrams, but it is even present at the “Page Load Cycle” diagram (css, image, etc.). Why “App cache” is pained right after “Redirect” at “Page Load Cycle”? Is it another kind of cache, not static content but something else?
- Labels:
-
real user monitoring
- Mark as New
- Subscribe to RSS Feed
- Permalink
03 Sep 2021 08:05 PM
@daniil_kochetov hopefully Dynatrace Support Reps can provide some clarity on the questions you have provided.
- Mark as New
- Subscribe to RSS Feed
- Permalink
09 May 2022 11:34 AM
Hi everyone!
Even thought It's been a while since this thread is posted, I think it raises a couple of really important questions that would be helpful for the future visitors of this forum. Does anyone of you has some tips or thoughts? Would be fantastic, thanks in advance for any feedback!


