- Dynatrace Community
- Ask
- Real User Monitoring
- Re: User Session Query Language for plotting response time
- Subscribe to RSS Feed
- Mark Topic as New
- Mark Topic as Read
- Pin this Topic for Current User
- Printer Friendly Page
- Mark as New
- Subscribe to RSS Feed
- Permalink
14 Sep 2021
12:20 PM
- last edited on
20 Sep 2021
09:36 AM
by
![]() MaciejNeumann
MaciejNeumann
Hi, I am trying to play the response time of various metrics like visuallyCompleteTime, networkTime, serverTime for some of my key user actions. What i want to do is create a chart where the average response time is plotted on Y-axis and time on X-axis so that I can compare how is it looking over the day.
I have tried one query but it's not giving me the results what i expected. Any advice or help is appreciated.
SELECT DATETIME(startTime, "HH:mm", "5m") as Buckets,  AVG(visuallyCompleteTime), MIN(visuallyCompleteTime), MAX(visuallyCompleteTime), AVG(ser) FROM useraction
WHERE name IN ("loading of page /myPage")
GROUP BY Buckets
This query is giving me below chart but it's not what I want.
Solved! Go to Solution.
- Mark as New
- Subscribe to RSS Feed
- Permalink
17 Sep 2021 01:39 PM
Hi Shashank,
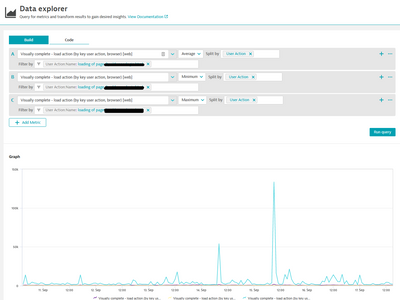
Maybe Data Explorer will make thing easier for you , you will have data in real time for all actions and not average by 5-min timerange ?
You can graph it easily ,splitted by key user action
Unless you really want to group data from multiple days on specific timeslot : if yes, your solution seems to be fine by your USQL Request.
What do you expect more than that's in your graph ?
Featured Posts


