- Dynatrace Community
- Ask
- Real User Monitoring
- Re: What are the requirement for RUM browser extension to work
- Subscribe to RSS Feed
- Mark Topic as New
- Mark Topic as Read
- Pin this Topic for Current User
- Printer Friendly Page
What are the requirement for RUM browser extension to work
- Mark as New
- Subscribe to RSS Feed
- Permalink
11 May 2019 04:26 AM
Hi,
I am working on opportunity for a airport where trying to deploy Dynatrace RUM browser extension for chrome.
What I had done so far
1) Install the Dynatrace RUM browser extension manually as workstation can't access to chrome store - Done
2) Request to allow the workstation to reach Dynatrace Saas/Cloud via proxy - Done as the chrome Dynatrace RUM browser extension is ableto connect to Application defined in the Saas tenant
However, when the workstation with the Dynatrace RUM browser extension installed going using chrome to hit the website to be monitor, the Dynatrace RUM browser extension icon is gray out and no user session data are reported back to the Saas tenant.
I did try from my own workstation and it works.
Hence, could someone kind enough to provide guidance on how should I debug ?
- Labels:
-
real user monitoring
- Mark as New
- Subscribe to RSS Feed
- Permalink
11 May 2019 05:39 AM
- https://js-cdn.dynatrace.com/jstag/1547c029d8c/ruxitagent_27SVfghqrtx_10167190506112612.js
- The JavaScript which responsible to capture User Session and Actions - https://bf10128sqm.bf.dynatrace.com/bf
- The URL which the above javascript need to report that data to.
- Mark as New
- Subscribe to RSS Feed
- Permalink
15 May 2019 09:21 PM
Hi Chuan,
I believe that the process you have taken to set this up is missing some crucial aspects. Please follow the following steps I found from this link and try again. If the problem still persists, please report back.
Set up the RUM browser extension
To set up the RUM browser extension
1 - Select Deploy Dynatrace from the navigation menu.
2 - Click the Monitor via browser extension button in the "No access to your host?" section.
3 - Click the Set up monitoring button.
4 - Install the Dynatrace browser extension for Google Chrome, Mozilla Firefox, or Microsoft Edge.
- Click the Copy button to copy the configuration URL.
- Click the Dynatrace icon (grayed out) in the browser toolbar to open the extension.
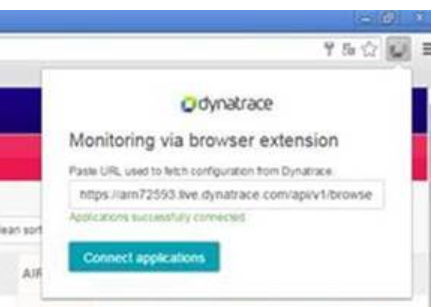
- Paste in the copied URL and click the Connect applications button.
- If the extension successfully fetches the configuration, you'll see the following message:
Applications successfully connected
5 - Switch back to Dynatrace and type a Name for your application.
6 - Define the URL injection pattern. This is a regex pattern that the extension applies to the current URL. When the pattern matches, the extension injects the Dynatrace JavaScript tag and begins gathering RUM data.
7 - Click Create application.
8 - Open the extension again and click the Connect applications button to ensure that you've loaded the latest configuration.
Open a new browser tab and visit the configured application. You'll now see that the Dynatrace icon is displayed in full color. This means that the extension has injected the JavaScript tag successfully and monitoring of the page is underway. If you switch back to Dynatrace, you'll see the first user actions coming in. Click View application to view the application's overview page.
- Mark as New
- Subscribe to RSS Feed
- Permalink
16 May 2019
03:23 AM
- last edited on
24 Mar 2021
01:08 PM
by
![]() MaciejNeumann
MaciejNeumann
Hi Billy,
The issue that my client is facing is that RUM browser ext. is able to connect to the Saas env as shown below. However, visiting the configured web page, the Dynatrace icon is still gray out. As mention, I suspect that it requires the following URLs to be accessible:
- https://js-cdn.dynatrace.com/jstag/1547c029d8c/ruxitagent_27SVfghqrtx_10167190506112612.js - The JavaScript which responsible to capture User Session and Actions
- https://bf10128sqm.bf.dynatrace.com/bf -
In this environment, there's a WAF between the client workstation to the Internet and every URL need to be in the include list. In any case, had to raise a RFC to add the above URL into the include list and hopefully, it works. I am asking if there's other URL that I need to aware of to raise as raising a RFC take quite a bit of time and effort.

- Mark as New
- Subscribe to RSS Feed
- Permalink
16 May 2019 02:54 PM
Hi Chuan,
I see your problem. I do not believe a RFE is the right approach here. If you believe you have followed the steps correctly and it is still not working then you should open a support ticket which you can do here.Please provide them with as much information as possible, such as a link to this post and your tennant URL.
I hope this gets resolved for you.
Regards,
Billy
