- Dynatrace Community
- Dynatrace
- Learn
- Troubleshooting
- How to validate the Android Agent is working properly
- Subscribe to RSS Feed
- Mark as New
- Mark as Read
- Printer Friendly Page
- Mark as New
- Subscribe to RSS Feed
- Permalink
on 03 Jan 2023 02:42 AM
If you are not seeing data in the WebUI after running through the steps given in the "Get started with Android monitoring" section of the help docs, here are some ways to confirm that the steps you've taken are implemented correctly:
Step 1
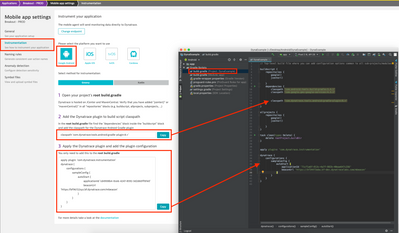
The first thing you want to check is that the code snippet that was copied from the WebUI (Application -> Mobile App -> Ellipsis (...) button -> Edit -> Instrumentation page -> Android tile -> See step 2 and step 3) is added to the top-level build.gradle file.

If this is code snippet is not added to the top-level build.gradle, instrumentation will not work.
Step 2
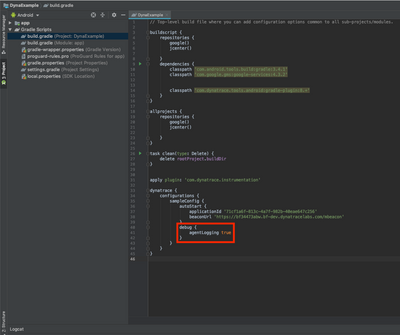
Once you've confirmed that the code snippet is in the top-level build.gradle, you should enable debug logging so that we can see what is happening on the Android agent side via logcat in Android Studio. Please see our help docs and the screenshot below for an example of enabling debug logging:
Step 3
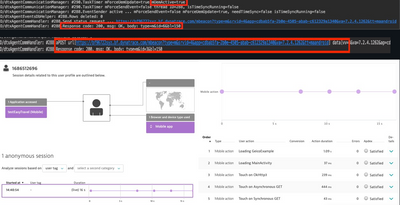
Rebuild your application with the new debug logging setting added and run a test session on your test device or emulator. In the Logcat tab (CMD + 6 for Mac or Ctrl + 6 for Windows) do a search for type=m which will bring you to the response of the mobile beacon and validate that the communication between the Android Agent and the beacon forwarder (Cluster AG or OneAgent) is valid. You can then search for vv= and that line will show the key/value pairs that contain the captured data by the Android agent which is sent back to the beacon forwarder > Cluster to get correlated into the session. If you see these in your Logcat output, you should then see data in your WebUI after correlation is completed for the data that was sent. The following screenshot is from an old agent (and cluster) version. When the using a new agent and cluster version then the logs may look slightly different.

Some search terms that will be beneficial to look for in the debug Logcat output:
- type=m
- ONLY VALID FOR OLD AGENT
- Shows that the mobile beacon returned a valid response and communication should be good between the Android Agent and the Beacon Forwarder
- Response code:
- You can see what the response code is for the mobile beacon like 404 or 403 which will validate that there is an issue with that specific endpoint which is a good starting point to investigate an issue
- There are also other scenarios, where the agent was not able to establish a connection with the ActiveGate. In this case it is very likely that you will find a communication exception is the logs. The root cause for the problem can be found in the exception message.
- vv=
- Shows that the mobile beacon was sent from the mobile app to the Beacon Forwarder and if nothing down the chain changes the beacon, you should see the data in the WebUI after correlaton
- Note: The logs show only a preview of the data. The showed data is incomplete and contains invalid values. It gives you a good overview of how many events are monitored and which type of events are monitored (user actions, web requests, ...).
- beacon or mbeacon
- You can see the beaconUrl from the startup configuration and you can find all of the mobile beacons that are requested from the time that the session starts
- mUemActive
- INTERNAL VALUE: it will be dropped in a future agent version. It is better to create an RFA
- This is set to false if the Android Agent is not capturing data, if true, this means that the Android Agent is actively capturing or waiting for User Actions to be triggered to capture

