- Dynatrace Community
- Ask
- Alerting
- Problems without alerting profiles
- Subscribe to RSS Feed
- Mark Topic as New
- Mark Topic as Read
- Pin this Topic for Current User
- Printer Friendly Page
Problems without alerting profiles
- Mark as New
- Subscribe to RSS Feed
- Permalink
07 Dec 2021
08:58 AM
- last edited on
09 Dec 2021
08:23 AM
by
![]() MaciejNeumann
MaciejNeumann
Dear All,
We noticed that sometimes the alerting profiles are not part of the problems.
What could be the reason behind this situation?
Regards,
Babar
- Labels:
-
problem detection
-
problems classic
- Mark as New
- Subscribe to RSS Feed
- Permalink
07 Dec 2021 10:38 AM
This mean that no condition was meat.
Example:
For this entity, if the alerting profile must be applied after 10 or 15mn, you AP will be applied, so if the problem is opened for only 5mn, the alerting profile is no applied for this.
Or the entity related with this problem have no Tag or MZ...
- Mark as New
- Subscribe to RSS Feed
- Permalink
07 Dec 2021 01:05 PM - edited 07 Dec 2021 01:06 PM
So this happens when there is a gap in your detection to alerting and notification. For example lets say you have a spike in CPU on Host X. You have an alert profile created which incorporates this Host X and any of its alarms. But that Alert Profile has time constraints set to it. For example you may have it set for resources to only alter alert a problem has been open for 30 mins. Therefore the CPU problem has been detected, but has not triggered an alert profile since the issue has not been open for 30 mins. Once that time frame is hit, then you will see the linkage of alert profile and an alert notification linked to that profile will be triggered.
- Mark as New
- Subscribe to RSS Feed
- Permalink
09 Dec 2021 06:48 AM - edited 09 Dec 2021 06:49 AM
Hello @Malaik and @ChadTurner
Thank you for your valuable comments.
I was waiting to collect a reasonable use case to share with you for a better understanding. In the following screenshot, you will find two different problems one with the detected profile and the other one is without detection (MZ and AP configured for both).
Both are configured to alert if the service stays in an abnormal state for at least 10 minutes. Now there are two following cases:
- Why was the AP is part of only one problem?
- Why was the alert triggered before 10 minutes?
Regards,
Babar
- Mark as New
- Subscribe to RSS Feed
- Permalink
13 Dec 2021 03:55 PM
for the slowdown problem, I would Verify your alert profile settings to ensure it is set to 10 mins. Yes users will be able to see issues as early as the thresholds are defined at the entity level (AI or Custom Thresholds). Then once the Alert Profile is qualified, we would see it link up.
It could very well be that the first Alert, the slowdown, Alert Profile is corrupted or malfunctioning. I would recommend deleting it and re building it. This can also be done via API by getting the details then posting a new one once its deleted. And then test to see if the issue is still happening.
If it is still happening and the alert is being raised and paged out prior to the qualifying defined Alert Profile time, even after deleting and recreating it, you might need to open a support case on this.
- Mark as New
- Subscribe to RSS Feed
- Permalink
19 Dec 2021 02:15 PM
Hello @ChadTurner
There are many things to discuss here but I am surprised who has accepted as a solution (on the lighter node) 😀
I will discuss further points to clear the concept.
Regards,
Babar
- Mark as New
- Subscribe to RSS Feed
- Permalink
20 Dec 2021 10:20 AM
Sorry @Babar_Qayyum , it was a mistake on my part - now it's unaccepted again 🙂
- Mark as New
- Subscribe to RSS Feed
- Permalink
20 Dec 2021 10:55 AM
Hello @MaciejNeumann
No problem at all. I was just curious because I wanted to continue this discussion.
Regards,
Babar
- Mark as New
- Subscribe to RSS Feed
- Permalink
20 Dec 2021 01:20 PM
@Babar_Qayyum were you able to delete and recreate the alert profile that failed to attach an alert profile to your problem card - for problem 346?
Also were you able to confirm that the alert profile is set to alarm at 10 mins for problem 347?
- Mark as New
- Subscribe to RSS Feed
- Permalink
27 Dec 2021 01:19 PM
Hello @ChadTurner
Apologies for the late reply. I believe there is no need to recreate the alerting profile. I brought one more interesting finding to do some more brainstorming.
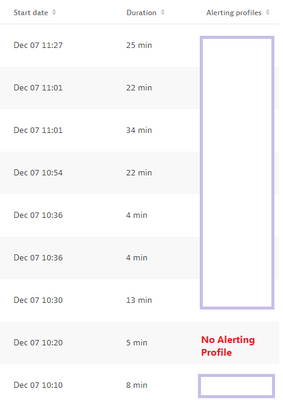
In the below screenshot, you will find 5 slowdown performance problems for the same alerting profile. Anomaly detection configured for 15 minutes (Only alert if the abnormal state remains for at least: 15 minutes). According to the previous discussion, the alerting profile should be tagged once the anomaly detection time will be true (in our case 15 minutes).
If this theory is true then, the first 2 problems make sense but what about the 3rd and 4the one?
Regards,
Babar
- Mark as New
- Subscribe to RSS Feed
- Permalink
27 Dec 2021 01:39 PM - edited 27 Dec 2021 01:47 PM
@Babar_Qayyum If the Alert Profile isn't functioning as expected then yes I would delete it and make a new one, its quite simple and you could even pull the Json from the API and then Re Posts it in a matter of seconds.
Problems 808 and 809 are both linked to an alert profile prior to the 15 min mark. But in the previous discussion you referenced a 10 min period as set on the alert Profile. So im a bit confused. Never the less, if the Alert Profile was set for 10 mins then there is no problem, If it was set for 15 mins then it associated to the alert profile prior to 15 mins.
Problems 807 and 806 are both past the 10/15 min mark and therefor are linked to an alert profile and there is no issue.
Problem 801 is well over the time frame and is not linked to an alert profile, but there are 5 entities that are affected in that problem. I would be curious as to what those 5 entities are and the reported problems and how they are associated to a management zone and therefore your alert profile.
It looks to me like Dynatrace is working without issue, the problem is when a complex problem is raised, depending on how your Dynatrace instance is organized, it might be looking at a different alert profile that has a larger timeframe such as 60 mins, then alert.
If you feel that this is incorrect I would recommend doing the repost of the alert profile or open a case up with support.
I also want to clear up the vernacular as we might be confusing ourselves. when you stated: "you will find 5 slowdown performance problems for the same alerting profile. Anomaly detection configured for 15 minutes (Only alert if the abnormal state remains for at least: 15 minutes). According to the previous discussion, the alerting profile should be tagged once the anomaly detection time will be true (in our case 15 minutes). "
Anomaly Detection is set at the entity level and this is the criterial in which an alert would be raised. No time delay is set at the Anomaly Detection Level.
Alert Profile is what contains the rules in which an alert would qualify for. This is where you would leverage a Management Zone, Alerting classifications/rules such as Resource problems that are open for 10 mins or more.
Alert Integration is linked to the alert profile and then pages out those problems that qualify to that linked alert profile.
- Mark as New
- Subscribe to RSS Feed
- Permalink
27 Dec 2021 02:07 PM - edited 27 Dec 2021 02:08 PM
Hello @ChadTurner
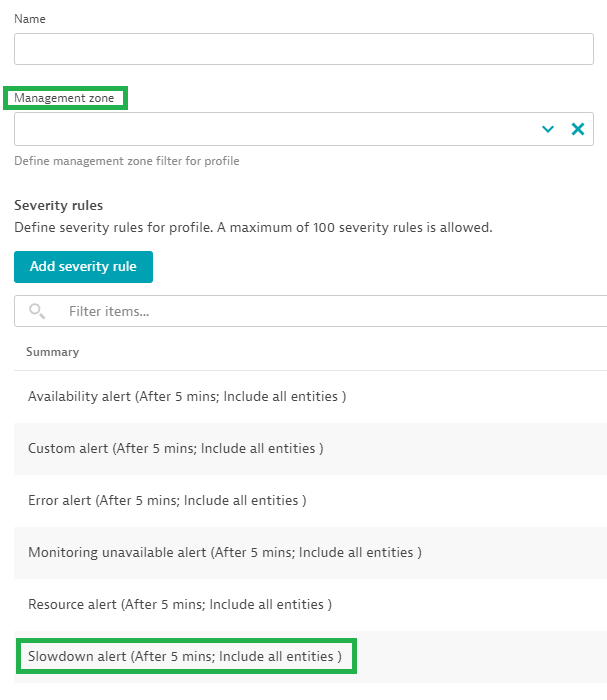
First of all, I did a mistake while explaining my case. The alerting profile for the "Response time degradation" is configured for 5 minutes.
Secondly, problem 801 was tagged perfectly fine but the remaining problems tagged only the default profile. Here is my confusion!
Why not all the problems tagged to the configured profile like 801? Although, all of them were opened more than 5 minutes.
I hope this time I am not confusing.
Regards,
Babar
- Mark as New
- Subscribe to RSS Feed
- Permalink
27 Dec 2021 02:13 PM - edited 27 Dec 2021 02:13 PM
@Babar_Qayyum So if you want them all to be linked like the 801 problem card, then you need to ensure that the alert profile that is set, includes (if applicable) the Management Zone in which those entities reside. If you are not using Management Zones you could be using tags, ensure that you have the correct tags set for the detection of the entity.
Are you able to share with us a screen shot of the alert profile?
- Mark as New
- Subscribe to RSS Feed
- Permalink
27 Dec 2021 02:28 PM
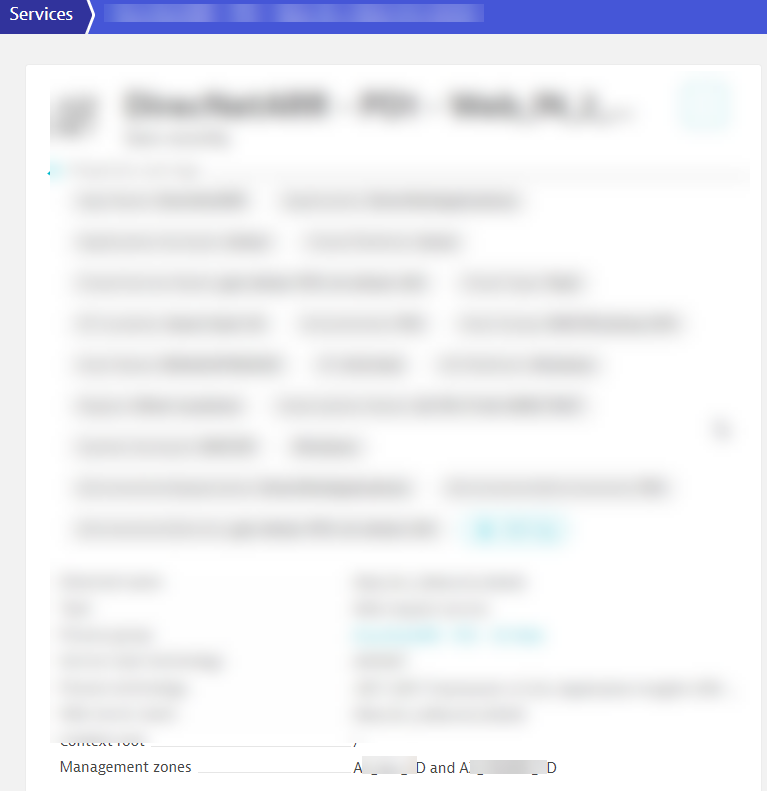
okay, and so the problems that we saw prior that were listed as "Default" can you access those entities and ensure they are part of that Management Zone. For example if a response time degradation affected a service, I could see that service in the Management Zone:
Verifying this will allow you to confirm or deny if this entity would in fact be associated to the alert profile via the set Management Zone. If the service, or any entity for that matter, isnt included in the original Management Zone, then the alert profile will not be associated to any problems detected.
- Mark as New
- Subscribe to RSS Feed
- Permalink
27 Dec 2021 02:43 PM - edited 27 Dec 2021 02:47 PM
Hello @ChadTurner
I verified. Both services (tagged and untagged) problems are associated with the same MZ.
Regards,
Babar
- Mark as New
- Subscribe to RSS Feed
- Permalink
27 Dec 2021 02:53 PM
okay, So we have verified that everything is set at the alerting profile as desired. We have also verified that the entities with and without the visual alert profile tag on the problem cards are indeed part of the Management Zone as desired.
At this point, your alert profile should be assigned to entities that qualify, unless the alert profile became corrupted. Which I have ran into myself. As a final attempt to get it working as desired I would delete and recreate just the alert profile, if this is not possible, create another alert profile that is identical to this one, just call it <AlertProfileName> V2. and test it, your new V2 should link up to the problem card.
Lastly the only other thing I noticed was your UI layout of the Alert Profile. I'm assuming you are a managed customer. Make sure your Cluster is updated to the most recent version available as Dynatrace has redesigned the Alert Profile UI.
If these changes, Secondary Alert Profile - Cluster Update still fails to provide the results as desired, then a support ticket would be our last option.
- Mark as New
- Subscribe to RSS Feed
- Permalink
27 Dec 2021 02:56 PM - edited 27 Dec 2021 02:57 PM
Hello @ChadTurner
Thank you for sharing your personal experience and further actions to verify.
I will work on it and will update you accordingly.
The cluster is already on the latest version.
Regards,
Babar
Featured Posts


