- Dynatrace Community
- Ask
- Dashboarding
- Re: host availability by management zone
- Subscribe to RSS Feed
- Mark Topic as New
- Mark Topic as Read
- Pin this Topic for Current User
- Printer Friendly Page
- Mark as New
- Subscribe to RSS Feed
- Permalink
03 Apr 2024
03:52 AM
- last edited on
03 Apr 2024
08:06 AM
by
![]() MaciejNeumann
MaciejNeumann
I would like to add a single value visualization to my dashboard that takes the average availability of all hosts in the selected management zone. I can create a metric in data explorer after selecting one of the hosts in the management zone but the query is very specific to the host I select. Can this value be dynamically updated each time I change the management zone.
Solved! Go to Solution.
- Labels:
-
dashboards
-
hosts classic
-
management zones
- Mark as New
- Subscribe to RSS Feed
- Permalink
03 Apr 2024 06:22 AM
Hi,
You can add dynamic filters to Classic Dashboard or variables to new Dashboards (Grail).
Best regards
- Mark as New
- Subscribe to RSS Feed
- Permalink
03 Apr 2024 12:33 PM
Thanks. The dynamic filters solve for individual host metrics but I still need a query that captures avg of availability for all hosts that are part of the management group that is selected.
If I select a host from the management group I can drill down to its availability and open in Data Explorer:
(builtin:host.availability.state:filter(eq("dt.entity.host",HOST-XXXXXXXXXXX)):auto:sort(value(sum,descending)):splitBy("availability.state")/builtin:host.availability.state:filter(eq("dt.entity.host",HOST-XXXXXXXXXXXX)):auto:sort(value(sum,descending)):splitBy()*100):setUnit(Percent)
but that is the availability specific to that host. If my management zone had 4 hosts or 10 hosts can I get the avg availability of the hosts dynamically?
- Mark as New
- Subscribe to RSS Feed
- Permalink
03 Apr 2024 01:16 PM
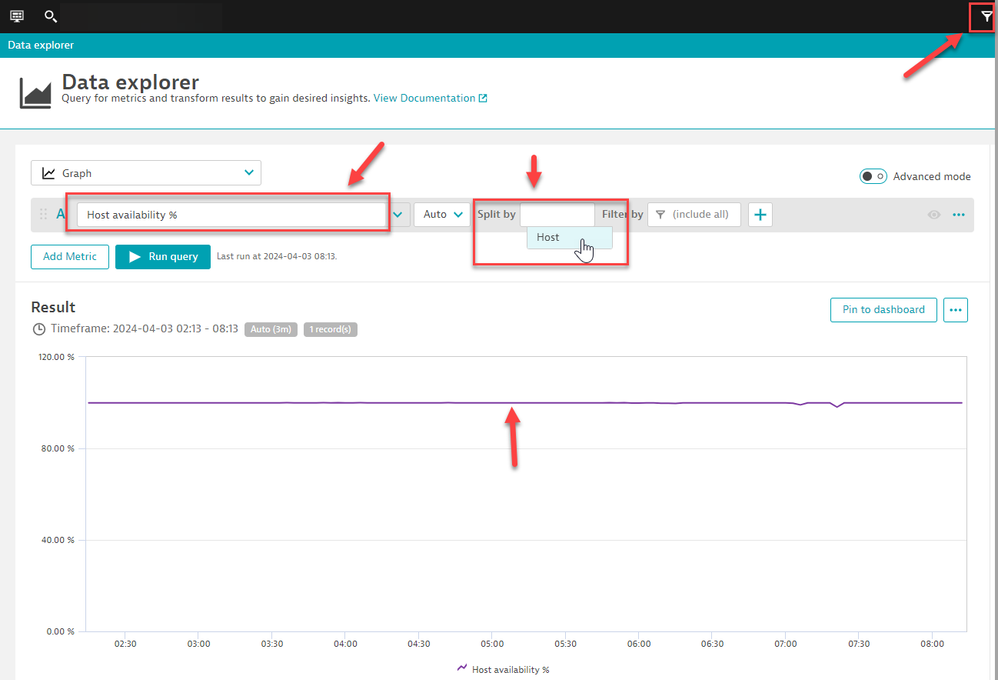
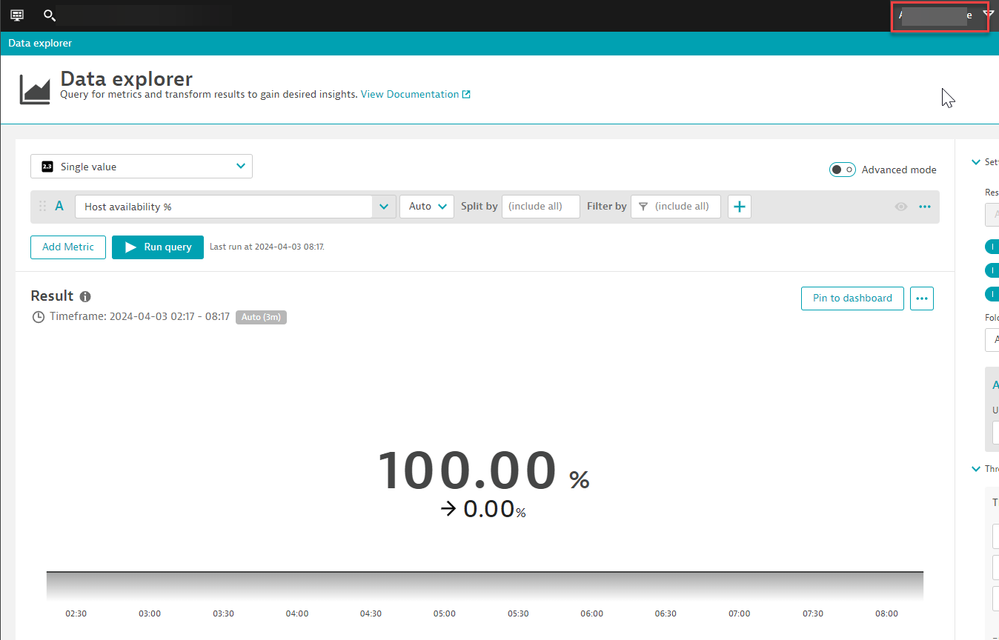
This is easily achievable my setting your Metric and Management Sone in the upper right hand corner. You can then apply a single value chart if so desired but it will be an aggregate of all the hosts. You can split it by hosts for a more in-depth view.
- Mark as New
- Subscribe to RSS Feed
- Permalink
03 Apr 2024 01:18 PM
You can go crazy with it by adding color overrides etc, so if its 99 - 100 its green, 95-99 yellow and less than 95 red
- Mark as New
- Subscribe to RSS Feed
- Permalink
03 Apr 2024 03:53 PM
totally missed the built in metrics.... thanks.
Featured Posts


