- Dynatrace Community
- Learn
- Dynatrace tips
- Re: PRO TIP - Setting an onboarding date stamp
- Subscribe to RSS Feed
- Mark Topic as New
- Mark Topic as Read
- Pin this Topic for Current User
- Printer Friendly Page
- Mark as New
- Subscribe to RSS Feed
- Permalink
01 Mar 2023 08:27 PM - edited 02 Mar 2023 01:23 PM
As more organizations move to the cloud, the deployment of Dynatrace becomes automated if not a birthright. I have gotten requests and questions from many customers as it relates to seeing and marking all these new entities. Granted every organization is different, some might be posting custom metadata ingested from their CMBD, others working with what Dynatrace offers without custom configuration of Metadata. Luckily, I have a solution and it can be leveraged by all customers.
Two Core Asks/Questions:
1 - How do we suppress alerts for freshly onboarded entities in PRD and are not live yet?
2 - How do we group/capture new entities in our Dynatrace environment?
Solution:
"First Time Seen"
All entities with a OneAgent will gain a Millisecond timestamp of when the "FirstTimeSeen' is. This data exists in the backend of each Host/Process/Service in Dynatrace. Now you can't just grab this data as a tag since Dynatrace doesn't offer first time seen and a taggable constrict via monitored entities. But you can target it if you use the entity selector.
So how do we do this?
First you need to brainstorm and figure out how your organization wants to structure time. If you structure this correctly, it will not only solve the two asks above, but also give you reporting capabilities too which we will get into once this is all set up.
My recommendation is slicing time into Year, Month and Week. Doing this allows you to have the overview of the year but also granularity of a given work week. So, let's do that. First step is to get open excel, or you can cheat and use the template I have attached 🙂
How to use the Excel File:
Step 1 - I supply the Day, Month, Year and time for EST Time Zone and I put that into a batch converter for EPOC time. This can be access via this link.
Step 2 - Take those EPOC times and paste them in the columns.
Step 3&4 - Excel will convert them EPOC time to Milliseconds take those, cell values and paste them above, but make sure you paste them as values.
Step 5 - With the Millisecond times supplied, Excel will create the entity selector text. Once again you will need to copy and paste this content but paste it was values.
You now have the entity selector string (but we will make one minor change later). The same method is applicable for all tabs in the excel workbook.
So, what is this string doing?
The entity selector is looking at the first time see, but there isn't a range we can define. our only options are:
lte: earlier than or at the specified time
lt: earlier than the specified time
gte: later than or at the specified time
gt: later than the specified time
So as a result, our string says to look at the first time seen 'later than or at the specified time' (GTE). Since this statement is forward looking and somewhat endless, we add another string to look into the future past by saying First time seen 'Earlier than or at the specified time' (LTE). This is essentially telling the system to look at January 1st at 00:00 and look forward from that time frame, this forward looking continues until it it's the past looking rule to then say look backwards from February 1 at 23:59 which basically traps the rule to be contained in Jan 1 - Feb 1.
One other limitation at this time is we can only do this for one entity type at a time. So yes, you will need to formulate the set of strings for host, then copy the strings and do a find/replace of host with service, and process group instance. But we will get to that a bit later on.
Setting up your JSON for Auto Tag posting via the Dynatrace API.
Now that we have the excel sheet completed and we have the main set of strings for our time slices of Week, Month and Year, we can start to compile the Json. I personally like to use NotePad++. You can download this for free online if you do not have it already or you can use a text editor of your choice.
First, we need to add in each rule which calls out the time frames via the string excel set for us and we will then define the Key and Value Pair for the tag.
Sample:
{
"enabled": true,
"entitySelector": "type("host"), firstSeenTms.gte(1704085200000), type("host"), firstSeenTms.lte(1735707540000)",
"valueFormat": "2024",
"normalization": "LEAVE_TEXT_AS_IS"
},
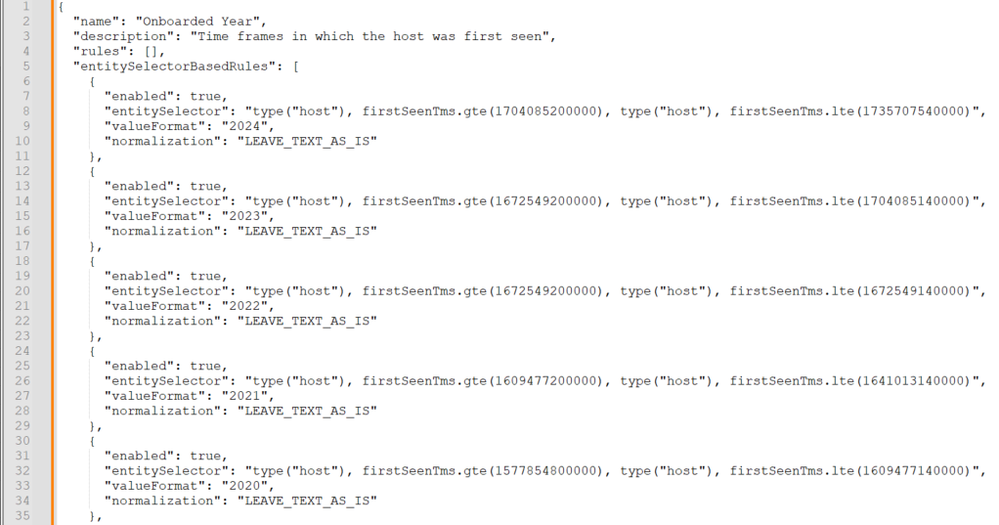
You will notice my rule is set to true, but my entity selector is targeting Hosts from January 1, 00:00 of 2024 to Dec. 31, 23:59 of 2024. And the value those entities will get is "2024". It is quite simplistic but you'll need to paste and update the value per set of years you want. I am targeting 2020 - 2024.
Once completed your set of strings should look like this:
Now remember as I mentioned above, the entity selector will only target the first type of entity supplied in the string - trust me I have tried to combine multiple, and it will not tag anything but the first defined entity type in the string. But that is not a big deal, we can just copy the rules you made. So, I am going to copy lines 6 - 35 and paste them into another page of my text editor.
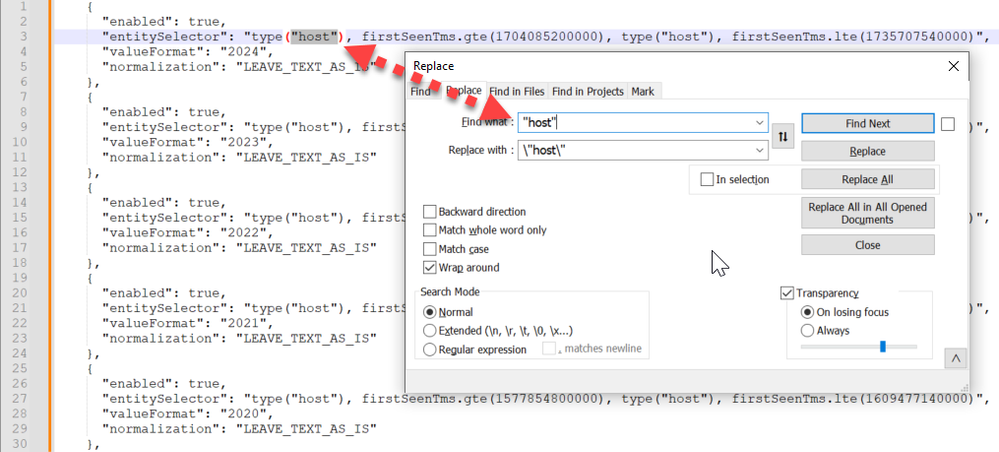
With lines 6-35 in another page, I am going to select "host" and do a find/replace. I am replacing "host" with \"host\".
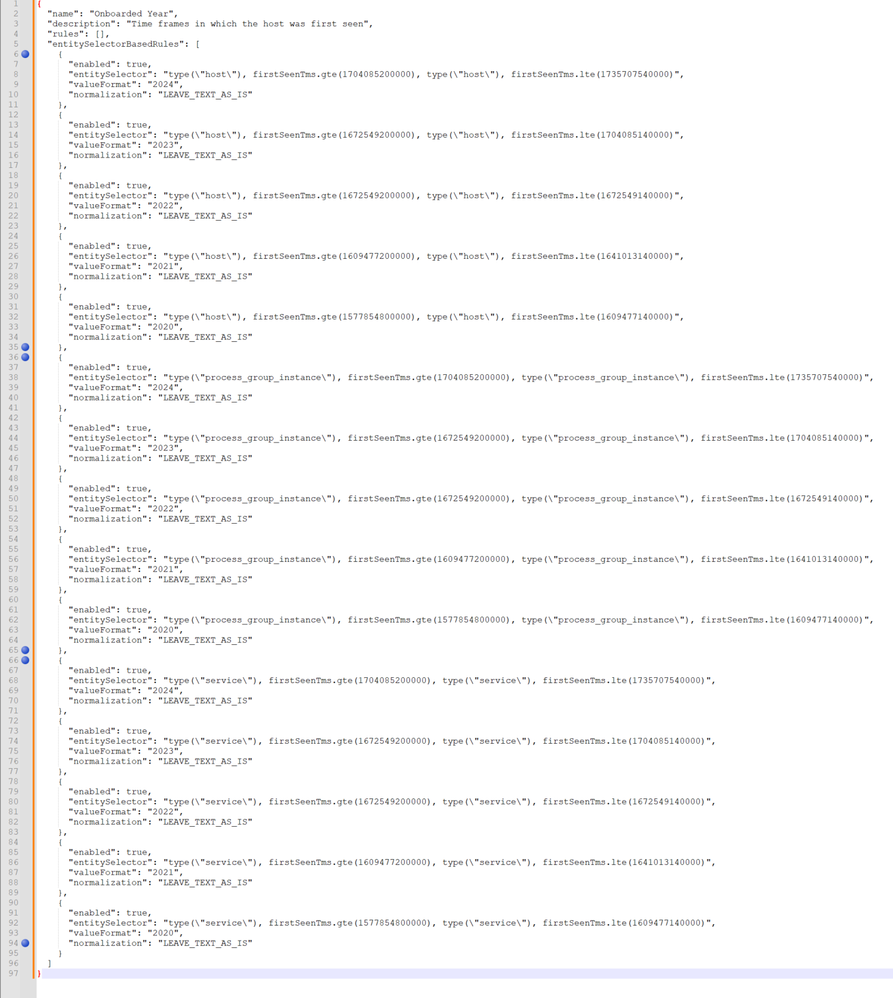
Hit replace all, and you just completed the tags for hosts, now let us copy all those lines and paste them back into the original sheet that will be our API posting JSON. Keep in mind, we need to do this now for service and process group instances. So, let us repeat the steps. Since I still have the lines 6-35 on another page, I will just jump back over and do another find and replace and replace the \"host\" with \"service\". Copy and paste all those lines over to your main Json page and repeat it once more for Process Group instances. So, I will find and replace the \"service\" with \"process_group_instance\". copy and paste that over to the main Json page. you should now have a page that looks something like this. (I put the blue dots so you can see the end/start of each entity type sets.)
You will do this for each time slice that you are going to leverage. It's important to note that you are limited to 150 rules in each tag set by default. So, when you go to add in weeks... 52 weeks in a year, X 3 entity types = 156 Rules 😞 6 rules over the limit. So, we decided to split the time into a half year via Q1-Q2 and Q3-Q4.
As a result, the Key: Value Pairs reflect the following:
Key | Value |
Onboarded Year | YYYY (Example: 2023) |
Onboarded Month | Month MM (Example: Month 02) |
Onboarded Week (Q1-Q2, 2023) | Week ## (Example: Week 07) |
Onboarded Week (Q3-Q4, 2023) | Week ## (Example: Week 40) |
Onboarded Week (Q1-Q2, 2022) | Week ## (Example: Week 07) |
Onboarded Week (Q3-Q4, 2022) | Week ## (Example: Week 40) |
As you complete the Jsons go ahead and post them into your environment via the Dynatrace API: Configuration API>Automatically applied tags>POST New Auto Tag. You will need a valid Dynatrace Token with write access.
You can also use the Jsons I have compiled. just note, like Dynatrace, I drop out granularity over time so you can only target the weeks in which an entity was onboarded during the current year and previous year., after that you only have Month and Year.
Here is what the tags look like once completed:
Now that we have the tags/foundation set, lets satisfy those Asks/Questions.
Question 1 - How to we suppress newly onboarded PROD entities that are not live yet?
Well, all the challenging work is done, your tags exist, or will exist once the entity in which you are onboarding shows up. The reason we need to use tags is because Dynatrace MWs work off the unique entity ID and since the host is not onboarded yet, we do not know what that ID will be. So, let us say your EasyTravel Team built up new servers and you need to add the OneAgent into them, or even from an automated perspective, the EasyTravel Team informs you they are standing up a new server for EasyTravel and they will automatically report into Dynatrace. You just need to ask them two Questions:
1 - When will you provision these servers and add Dynatrace to them?
2 - When will the host(s) be live for Production?
With answers to those two questions, you can Formulate a Maintenance Window. So let's do that.
This can be done via the UI or API, however you want. in the UI you will open a new MW and fill it out as desired in accordance with your organization’s standards for MWs. Now at the filter section you will add in the tags as you see fit. Keep in mind we have several types of time levels, we have Weeks, Months, and Years. You can use all three, or you can drop each one to get a broader timeframe. So, if you team has a year to complete the app and will be onboarding things over the year, just include the Year of 2023. This method also applies to month, onboarding over the course of a month, add in that month. All the way down to the smallest time frame of week, stating it will be onboarded in Week 5 out of the 52-week year.
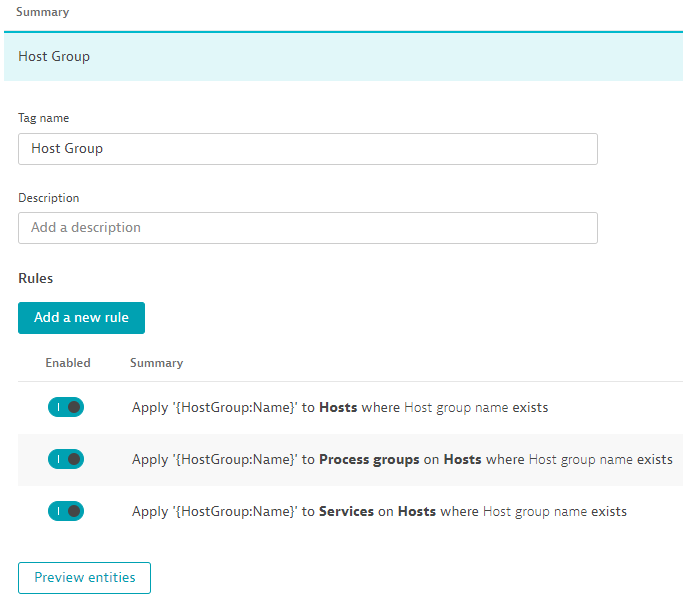
These tags alone are not enough to isolate your MW to select entities. Your time frame tags apply to all entities in the environment. So, we need to build one more tag if it is not present already, Host Group Name. you can do this right in the UI and is extremely easy:
Since Host Groups are unique, they also have a Dynatrace ID, so for Host Groups that haven't been created yet you can't target them until after they exist. So, we will use tags since we can define a tag in the MW even if it is not present yet.
Once the Tagging Rules are set let’s Revisit the MW and add in your Host Group Key: Value Pair with Tags.
You will want to add all of these on one filter as it allows you to use "AND" in-between the tags. So, the entities in which this MW applies will be entities with tag: Host Group:EZYTRVL AND Onboarded Week: Week 05 AND Onboarded Month: 02 AND Onboarded Year: 2023. So, the entity must have each and every one of those tags otherwise it won't be included.
If you add a new filter, it will use AND in the string as above, but it will but an OR in-between the two rule filter sets. Which can be extremely useful if you have several Host Groups in which this should apply to.
Here is an example:
Make sure you set your start date and time for your MW. It does not have to be right on point but needs to be earlier then when the entities go live as the MW will only apply to entities once they show up and meet the filter criteria you supplied.
Do not forget the end date and time, this is the most critical as that is when the MW will stop and should be in line with the Go-Live Date/Time so alerts can be generated, and integrations triggered for team notification.
Result:
To get the detailed instructions and Json Templates for posting Maintenance Windows click the following link: PRO TIP - Setting Maintenance Window for suppression of entities not live yet
Question 2 - How do we group/capture new entities in our Dynatrace environment?
As Cloud providers provide the ability to spin up and spin down things, Dynatrace Managers want to know the new stuff that has shown up. Well since the tag foundation is set, all you need to do now is formulate a MZ called newly onboarded entities and select your time range. Do you want to do it by Month? Quarter? Year? it is up to you. Build a Management Zone as you normally would but include all the entities (Hosts/Processes/Services) and include Onboarded Time tag you would like with the desired values, shortly after posting you will have the qualifying entities report into your new MZ 🙂 It's as simple as that!
Extra Functions - Reporting!
With these Onboarded Time Tags you can expand the solutions out from the original asks and can accurately answer the question of "when was this onboarded?" instead of trying to find out using the Global Time Frame Selector. You can also report to leadership on the amount of newly monitored entities across any time construct you want, even compare it historically Feb of 2022 we onboarded 500 new entities (200 Hosts, 200 processes and 100 Services) compared to Feb 2023 where we onboarded 900 entities (300 Hosts, 300 Processes, 300 Services).
The possibilities are endless 🙂
Solved! Go to Solution.
- Labels:
-
tips and tricks
- Mark as New
- Subscribe to RSS Feed
- Permalink
01 Mar 2023 08:29 PM
Resource Files Attached - onboarded Week Jsons
- Mark as New
- Subscribe to RSS Feed
- Permalink
01 Mar 2023 08:31 PM - edited 02 Mar 2023 02:35 PM
Resource Files Attached - Month and Year Jsons, Excel sheet for EPOC Time conversion and String Creation
- Mark as New
- Subscribe to RSS Feed
- Permalink
01 Apr 2023 04:49 PM
I just tested above for onboarded year and month and as usual, Chad has done some great work here!
- Mark as New
- Subscribe to RSS Feed
- Permalink
01 Mar 2023 08:37 PM
WoW! Very good material!
From what I have done in a couple of clients, this is what you get also when you have a good CMDB. But having that data available in Dynatrace is of course of great utility!
- Mark as New
- Subscribe to RSS Feed
- Permalink
01 Mar 2023 08:47 PM
exactly but that's just another thing that needs to be maintained and some organizations don't even like to mention a CMDB, granted I'm all for CMDB, and ingest all that data as custom metadata on your entities then formulate core auto tag rules off that metadata on the entities. but not all organizations have that. But... the FirstSeenTime is there every time, all the time 🙂
- Mark as New
- Subscribe to RSS Feed
- Permalink
01 Mar 2023 11:18 PM
Thanks Chad, great as usual.
- Mark as New
- Subscribe to RSS Feed
- Permalink
28 Mar 2023 02:19 AM
added HTTP_CHECK and SYNTHETIC_TEST
checking entities found that 2022 firstSeenTms.gte is showing start of 2023 instead of 2022
I did epoc conversion with powerbi reports. this method is better since it can improve upper management reporting.
- Mark as New
- Subscribe to RSS Feed
- Permalink
31 Oct 2024 02:52 PM
Hi @ChadTurner ,
Thanks for this great tip.
I tried to use your method, but as a long time this is published, the call API that you used is deprecated now.
Could you please indicate an example with the new call API , it appears to be in /settings/objects now?
Thanks for your sharing.
Regards,
Greg
- Mark as New
- Subscribe to RSS Feed
- Permalink
31 Oct 2024 04:03 PM - edited 31 Oct 2024 04:03 PM
Ok i found how to do it. I put the example of the payload to use for the "Onboarded Year" tag (only 2024 and 2025 years and in GMT):
[
 {
      "schemaId": "builtin:tags.auto-tagging",
      "scope": "environment",
      "value": {
        "name": "Onboarded Year",
        "description": "Time frames in which the host was first seen",
        "rules": [
          {
            "enabled": true,
            "valueFormat": "2024",
            "valueNormalization": "Leave text as-is",
            "type": "SELECTOR",
            "entitySelector": "type(\"host\"), firstSeenTms.gte(1704067200000), type(\"host\"), firstSeenTms.lte(1735603200000)"
          },
          {
            "enabled": true,
            "valueFormat": "2025",
            "valueNormalization": "Leave text as-is",
            "type": "SELECTOR",
            "entitySelector": "type(\"host\"), firstSeenTms.gte(1735689600000), type(\"host\"), firstSeenTms.lte(1767139200000)"
          },
          {
            "enabled": true,
            "valueFormat": "2024",
            "valueNormalization": "Leave text as-is",
            "type": "SELECTOR",
            "entitySelector": "type(\"process_group_instance\"), firstSeenTms.gte(1704067200000), type(\"process_group_instance\"), firstSeenTms.lte(1735603200000)"
          },
          {
            "enabled": true,
            "valueFormat": "2025",
            "valueNormalization": "Leave text as-is",
            "type": "SELECTOR",
            "entitySelector": "type(\"process_group_instance\"), firstSeenTms.gte(1735689600000), type(\"process_group_instance\"), firstSeenTms.lte(1767139200000)"
          },
          {
            "enabled": true,
            "valueFormat": "2024",
            "valueNormalization": "Leave text as-is",
            "type": "SELECTOR",
            "entitySelector": "type(\"service\"), firstSeenTms.gte(1704067200000), type(\"service\"), firstSeenTms.lte(1735603200000)"
          },
          {
            "enabled": true,
            "valueFormat": "2025",
            "valueNormalization": "Leave text as-is",
            "type": "SELECTOR",
            "entitySelector": "type(\"service\"), firstSeenTms.gte(1735689600000), type(\"service\"), firstSeenTms.lte(1767139200000)"
          }
        ]
      }
    }
  ]
Featured Posts


