- Dynatrace Community
- Ask
- Open Q&A
- Re: Error JavaScript without Stacktrace
- Subscribe to RSS Feed
- Mark Topic as New
- Mark Topic as Read
- Pin this Topic for Current User
- Printer Friendly Page
- Mark as New
- Subscribe to RSS Feed
- Permalink
18 Feb 2022
02:21 PM
- last edited on
21 Feb 2022
10:17 AM
by
![]() MaciejNeumann
MaciejNeumann
Hi.
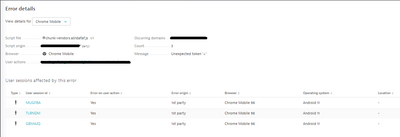
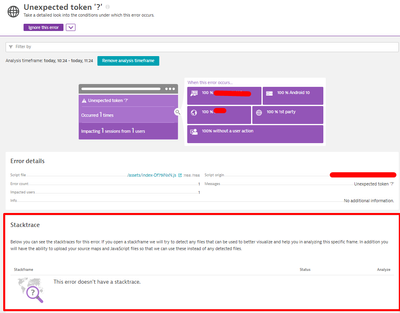
The application has some java script errors, but when I analyze it, I don't see stacktrace. Some other errors from the same application, I can see stacktrace. Could you say what could cause this difference?
Unexpected token '<'
Solved! Go to Solution.
- Labels:
-
javascript
-
problem detection
- Mark as New
- Subscribe to RSS Feed
- Permalink
04 Jun 2022 03:29 AM
Are you able to find the transaction via the purepaths?
- Mark as New
- Subscribe to RSS Feed
- Permalink
19 Apr 2024 01:47 PM
I have the same issue, however, my application is agentless, so not sure if that has a bearing. Though, even with agentless configuration, we have stacktraces from some errors but not others. Would be good to know why this would be the case.
- Mark as New
- Subscribe to RSS Feed
- Permalink
22 Apr 2024 05:38 PM
HI @gabrielle , @asp-vm
I was thinking that it's a problem UI, maybe with the browser (In the past, when I zoomed in and out in Dynatrace UI, some sectors would disappear. This especially happened to me at the beginning with the new Dynatrace interface, in the sectors where I identified it they have already corrected it).
After that, I have always found the "Stacktrace" sector, even if it has no related information.
- Mark as New
- Subscribe to RSS Feed
- Permalink
23 Apr 2024 09:15 AM
Hi @PierreGutierrez , my issue is not that there is no Stack trace section visible, but more trying to understand the reason why there is no Stack trace at all. So I have exactly the same as your screenshot. I just wanted to understand what scenarios would result in no stack trace being collected.
- Mark as New
- Subscribe to RSS Feed
- Permalink
23 Apr 2024 05:12 PM
Hi @asp-vm
Web application source maps
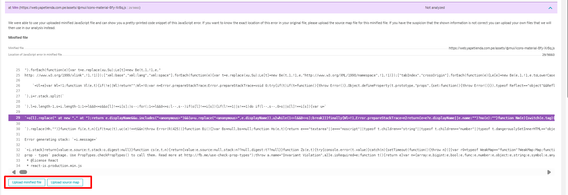
For show Stacktrace , dynatrace try to detect in files ( Java script min or source map) the error detected.
It is possible that dynatrace is not able to download these files and for that reason it is not able to display any type of StackTrace details.
I understand that currently it is only possible to upload "JavaScript" and "Source map", as long as an error detail is displayed.

https://docs.dynatrace.com/docs/shortlink/javascript-error-analysis#automatic-download-of-source-map...
Maybe you can try loading the source map of other JavaScript errors (where it does allow you to load the file) and then load the "source file (JavaScript)", as the recommendation indicates.
https://docs.dynatrace.com/docs/shortlink/javascript-error-analysis#analyze-a-javascript-error-using...

I hope to be helpful 💪
- Mark as New
- Subscribe to RSS Feed
- Permalink
23 Apr 2024 09:23 PM
@asp-vm other reason could be
There is no stacktrace, because this is not a javascript error, this is a parsing error for a javascript file.
The file is invalid, e.g. because it contains JSON (likely your screenshot) or html (then it usually says unexpected token <) instead of proper javascript.
For HTML files, this usually happens when a file is deleted and the webserver then e.g. returns a 404 page or some internal error happens and the webserver returns a 500 page.
- Mark as New
- Subscribe to RSS Feed
- Permalink
24 Apr 2024 09:20 AM
Thank you. This is really helps.
Featured Posts


