- Dynatrace Community
- Ask
- Open Q&A
- Re: POOR Apdex score & missing XHR data
- Subscribe to RSS Feed
- Mark Topic as New
- Mark Topic as Read
- Pin this Topic for Current User
- Printer Friendly Page
- Mark as New
- Subscribe to RSS Feed
- Permalink
20 Oct 2022 08:51 AM
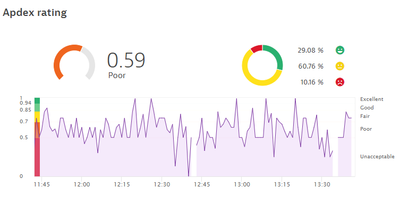
Our web application (Java, Spring, Postgres SQL, extJS, etc) is using Dynatrace and recently we had a task to verify the cause in the degradation of the APDEX score.
We understood that the score is being calculated based on the following:
-Load Actions
-XHR Actions
-Errors (JavaScript/HTTP)
XHR Actions
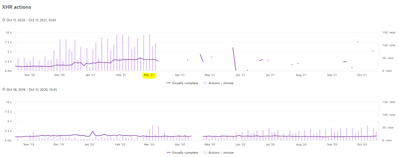
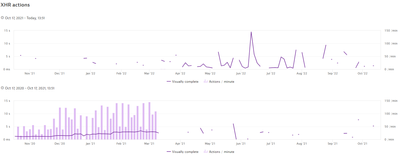
We noticed that since March 2021 there has been some inconsistencies in the XHR graph’s reading. Kindly see screenshot below which shows the XHR graph from November 2019 till now.
(Nov 2019 – Oct 2021)
(Nov 2020 – Oct 2022)
Do you know what might be the issue please? Whether or not there is a configuration that we are missing for the XHR graph.
Solved! Go to Solution.
- Labels:
-
apdex
- Mark as New
- Subscribe to RSS Feed
- Permalink
22 Oct 2022 09:39 AM
Based on the chart is looks like Dynatrace does not detect your user actions as the load dropped since March 2021. You must first find out if you are really capturing the XHR user actions. Look at your sessions if you are really receiving them as expected.
For analyzing Apdex values, check first the errors captured and adjust error detection rules in the application if necessary (some errors do not affect users, so it's required to ignore them from Apdex calculations). Also, adjust performance metric thresholds for actions where you don't want the default value.
- Mark as New
- Subscribe to RSS Feed
- Permalink
26 Oct 2022 01:36 PM - edited 26 Oct 2022 01:36 PM
Hello @Julius_Loman ,
Thank you for your reply.
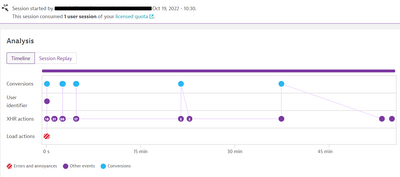
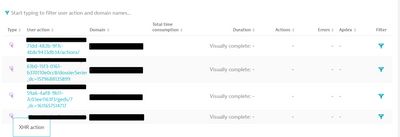
After going through the recorded user sessions. We've found that there were sessions that capture XHR actions and many others that have no XHR action capture.
With XHR actions
No XHR actions
Could you please confirm that the fact that we are missing those XHR data might as well be a cause to the bad APDEX score? Noting that we have key actions defined and all of them are XHR actions
- Mark as New
- Subscribe to RSS Feed
- Permalink
27 Oct 2022 09:40 AM
No, apdex is calculated from captured actions. So bad Apdex score has different reason for you. So you have basically these issues:
- Missing XHR actions (check what technology support for single page applications you have enabled)
- Low apdex - Filter your user actions for the frustrated and check the reason. It will be either errors happening or performance.
- I see your user actions have unique names. Is this really intended?
Featured Posts
