- Dynatrace Community
- Ask
- Synthetic Monitoring
- Re: Is the total duration time equal to total execution time for browser monitor?
- Subscribe to RSS Feed
- Mark Topic as New
- Mark Topic as Read
- Pin this Topic for Current User
- Printer Friendly Page
- Mark as New
- Subscribe to RSS Feed
- Permalink
04 May 2023
04:05 AM
- last edited on
17 May 2023
11:49 AM
by
![]() AgataWlodarczyk
AgataWlodarczyk
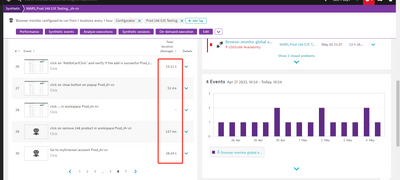
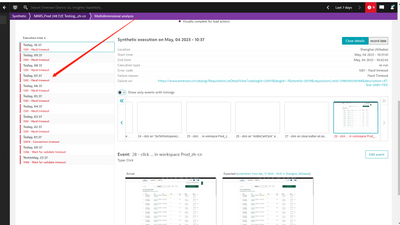
Hello, I encountered one issue for one couple of days. Our one synthetic monitor is often failed due to hard timeout error. But I checked each step of this monitor, The sum of all the step total duration it less than 5 minutes. But the monitor failed. I checked the failed step, there's no any useful information. So I have some questions:
1) Is the total duration time for all steps equal to the total execution time of this synthetic monitor?
2) We test the application and found the total duration is within 5 minutes. But the monitor failed. So, does anybody knows how I can get to know if the issue is due to Dynatrace cloud service issue or not?
The monitor url:
https://{environmentid}.live.dynatrace.com/ui/browser-monitor/SYNTHETIC_TEST-16ACC153BFCEA453?visiblepart=errors>f=-7d%20to%20now&gf=all
Solved! Go to Solution.
- Labels:
-
browser monitors
-
synthetic monitoring
- Mark as New
- Subscribe to RSS Feed
- Permalink
04 May 2023 11:22 AM
- Total duration is calculated as a summation of the User action duration of the load and XHR actions in a monitor.
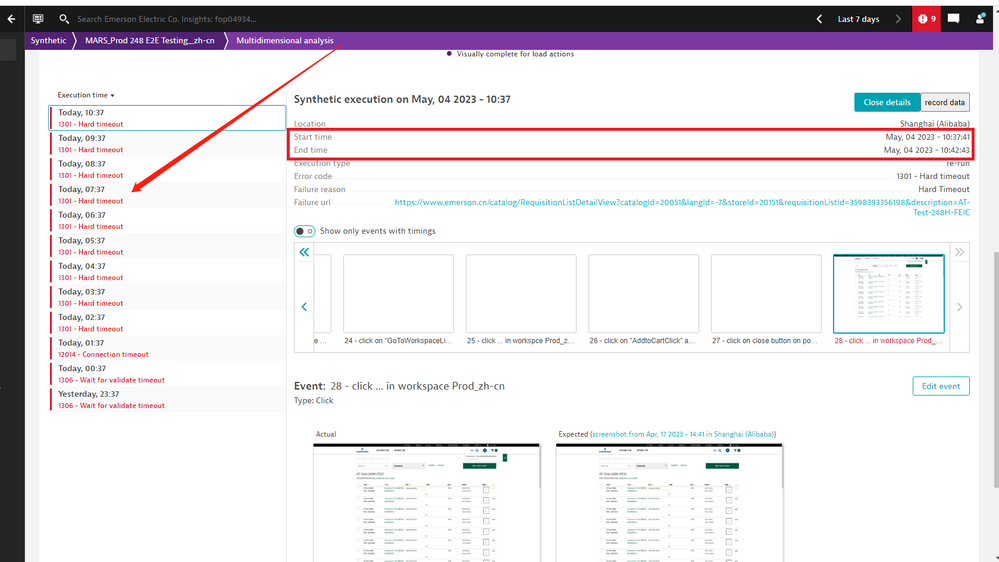
Execution duration can be worked out by checking the Start time and end time. As you see the execution duration for the execution in your screenshot is 5 minutes 2s. - Without looking at your monitor, I don't know what is causing this behaviour. What waits are you using? Are there many that wait for specified period of time? If so, I would try to change them to wait for next event or wait for a specified element. Where are you testing from? Are you near the data centre? If you test using a public location near your datacentre does that affect the timings?
If you would like your monitor investigated, please create a chat.
- Mark as New
- Subscribe to RSS Feed
- Permalink
04 May 2023 04:24 PM
Hi HannahM,
Thank you for you reply.
For the 2nd pont. Let me give you more detailes.
What waits are you using?
There is 31 events totally in our monitor. The event type and its related step count is as below:
Wait for page load completey : 3
All the other events are input step.
Wait for background network activity :5
Wait for next event: 17
Wait for specific time : 2 (one for 15s and another for 20s)
Where are you testing from?
- This monitor is executed on your cloud service, not our localhost.
Actually, I created one online chat but not get the accurate reply.
On the other hand, our developer did some code chanages for the 3rd party components according to dynatrace monitor result. But the availability isn't up but down and even down to 0% from yesterday. We can't get any useful information from the dynatrace. It just give us hard timeout error. We're so struggling with it. If anyone can help solve this problem, we would be grateful
- Mark as New
- Subscribe to RSS Feed
- Permalink
04 May 2023 04:38 PM
Thanks Quirina. ok, so the waits seem ok.
I was more womdering where you are playing back locally from, as you said the site is very quick. Are you also based in Shanghai?
Can you check the waterfalls for each event? Are there any failed or pending resources that you are not interested in? If so, can you block them in the Advanced setup?
- Mark as New
- Subscribe to RSS Feed
- Permalink
04 May 2023 04:51 PM
Thanks for your confirmation. I checked all the executed steps. On the 12th step, there are two 3rd party components were pending. But the 12th step executed successfully every time. And the monitor will be failed on 24th step nearly every time and without pending or timeout request. So, Could you check or restart your cloud service if there's no another solution for this issue?
- Mark as New
- Subscribe to RSS Feed
- Permalink
04 May 2023 05:18 PM
The monitoring is failing with a hard timeout, the timings of every event count towards that, os if you can speed up the monitor then that should help here.
We will switch over players next week when we update to 1.266. So all the machines and services will be restarted.
- Mark as New
- Subscribe to RSS Feed
- Permalink
05 May 2023 03:58 AM
Thank you for letting me know the latest progress. Could I know the specific time when you'll restart the services? Because we're doing general dynatrace issue analysis, if I can know the specific time, it will be helpful for us to compare the performance before and after the service restart. I'd really appreciate it.
- Mark as New
- Subscribe to RSS Feed
- Permalink
05 May 2023 09:08 AM
If you ask on chat, they will be able to check when the version changed. I expect this would be on Tuesday or Wednesday. As you can imagine, there are multiple servers for each public location so the update will be spread over time, but we can see in the execution logs, exactly which version player was used.
Featured Posts


