- Dynatrace Community
- Ask
- Dashboarding
- Recreate the data explorer chart session by means of the new dashboard in Grail
- Subscribe to RSS Feed
- Mark Topic as New
- Mark Topic as Read
- Pin this Topic for Current User
- Printer Friendly Page
- Mark as New
- Subscribe to RSS Feed
- Permalink
09 Oct 2023
11:12 AM
- last edited on
24 Jan 2024
11:44 AM
by
![]() Michal_Gebacki
Michal_Gebacki
Hi everyone,
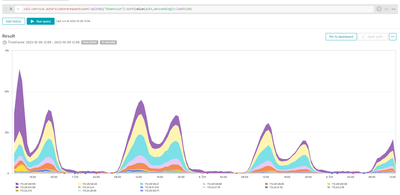
is that possible to recreate the chart made in the data explorer session by means of the new dashboard in grail?
The querry that i'm using is this:
calc:service.autorizzatorerequestcount:splitBy("Dimension"):sort(value(auto,descending)):limit(20)
where autorizzatorerequestcount is a custom metric splitter by the dimension Dimension...
Obtaining this graph:
I can't find any DQL that fetch those data, is there any way to achive such result?
Thanks,
Andrea
Solved! Go to Solution.
- Labels:
-
data explorer
-
dql
-
grail
-
latest dynatrace
- Mark as New
- Subscribe to RSS Feed
- Permalink
13 Dec 2023 12:22 PM
Hello @andreaCaria ,
Have you already found the answer to your questions? Let me know; if not, I'll look for someone to help. And if yes - maybe you would like to share the solution with the Community? 😉
- Mark as New
- Subscribe to RSS Feed
- Permalink
04 Jan 2024 01:51 PM
Hi @andreaCaria.
Calculated Service metrics are not available in Grail as of yet but will be in the future.
These are the current metrics, but you can get these from our API if required - https://docs.dynatrace.com/docs/observe-and-explore/metrics/built-in-metrics-on-grail
SDK - https://developer.dynatrace.com/reference/sdks/client-classic-environment-v2/#query
This JavaScript snippet below will give you the sum of your Calculated Service Metric in a single value. You can tweak the JavaScript to your needs as required:
import { metricsClient } from '@dynatrace-sdk/client-classic-environment-v2';

// Function to calculate the sum of numbers within values, replacing nulls with 0
function calculateSumOfValues(data) {
  let totalSum = 0;

  data.forEach(service => {
    service.values.forEach(value => {
      totalSum += value !== null ? value : 0;
    });
  });

  return totalSum;
}

export default async function fetchMetrics() {
  // Assuming dt_timeframe_from holds the timeframe from your site

  const queryParameters = {
    acceptType: "application/json; charset=utf-8",
    metricSelector: "**********", //Amend to your Advanced Data Explorer Query
    from: $dt_timeframe_from, // Using template literal to interpolate the variable
    resolution: "10m"
    // Add other parameters as needed: entitySelector, to, etc.
  };

  try {
    const data = await metricsClient.query(queryParameters);

    // Calculate the sum of numbers within values, replacing nulls with 0
    const totalSum = calculateSumOfValues(data.result[0].data);

    console.log("Total sum of values:", totalSum); // Output the total sum

    // Returning the fetched data and the totalSum with the name "totalSum"
    return { data, totalSum };
  } catch (error) {
    // Handle the error gracefully
    console.error("Error fetching metrics:", error);
    throw error;
  }
}
Thanks,
Lawrence
Featured Posts

